WHO: The spread of COVID-19 in China is Extremely Low
WHO: The spread of COVID-19 in China is extremely low
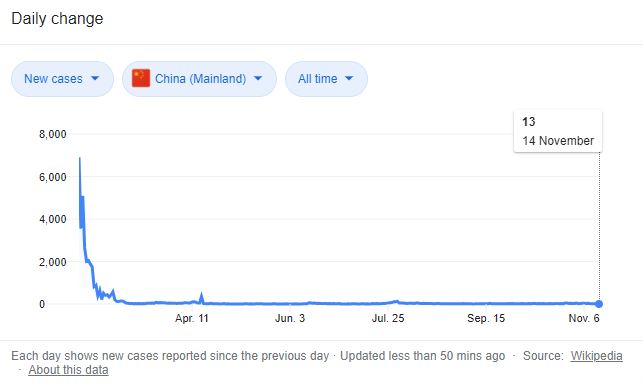
WHO: The spread of COVID-19 in China is extremely low. On November 16, local time, WHO held a routine press conference for COVID-19 pneumonia. Michael Ryan, head of WHO’s health emergency project, said that China and other countries have adopted comprehensive response measures to solve more serious epidemics and keep the spread of the virus at Very low level. At present, the number of cases in many countries is very small, but any country or region has the risk of imported cases or undetected cases.

Michael Ryan pointed out that existing evidence shows that the spread of the new coronavirus in China is extremely low. China has taken very active responses to any surge in COVID-19 cases, such as large-scale testing. This is not something that all countries can do, and it requires a lot of resources to achieve it. In this case, only a few cases were found. If there are a large number of undetected cases with local transmission, large-scale testing will find some cases. Therefore, there is no evidence that China is facing a significant epidemic problem.
Mainland China
Cases
Statistics Mainland China

Cases
|
Location
|
Total cases
|
New cases (1 day*)
|
New cases (last 60 days)
|
Cases per 1 million people
|
Deaths
|
|---|---|---|---|---|---|
|
Worldwide
|
54,678,159 | No data |  |
7,032 | 1,321,403 |
|
Mainland China
|
86,346 | 8 |  |
62 | 4,634 |
|
Hubei
|
68,148 | 0 |  |
1,165 | 4,512 |
|
Guangdong Province
|
1,968 | 2 |  |
No data | 8 |
|
Zhejiang
|
1,291 | 0 |  |
23 | 1 |
|
Henan
|
1,288 | 0 |  |
No data | 22 |
|
Hunan
|
1,020 | 0 |  |
15 | 4 |
|
Anhui
|
992 | 0 |  |
16 | 6 |
|
Xinjiang
|
980 | 0 |  |
45 | 3 |
|
Heilongjiang
|
949 | 0 |  |
25 | 13 |
|
Jiangxi
|
935 | 0 |  |
21 | 1 |
|
Shandong
|
848 | 0 |  |
No data | 7 |
|
Sichuan
|
786 | 3 |  |
10 | 3 |
|
Jiangsu
|
677 | 1 |  |
8 | 0 |
|
Beijing
|
587 | No data |  |
27 | 8 |
|
Chongqing
|
579 | No data |  |
19 | 6 |
|
Shanghai
|
536 | No data |  |
20 | 6 |
|
Shaanxi
|
487 | 1 |  |
13 | 3 |
|
Fujian
|
461 | 0 |  |
12 | 1 |
|
Hebei
|
373 | 0 |  |
5 | 6 |
|
Inner Mongolia
|
307 | 0 |  |
12 | 1 |
|
Liaoning
|
288 | 0 |  |
7 | 2 |
|
Guangxi
|
260 | 0 |  |
5 | 2 |
|
Shanxi
|
219 | 1 |  |
6 | 0 |
|
Yunnan
|
217 | 0 |  |
5 | 2 |
|
Gansu
|
181 | 0 |  |
7 | 2 |
|
Tianjin
|
180 | No data |  |
12 | 3 |
|
Hainan
|
171 | 0 |  |
18 | 6 |
|
Jilin
|
157 | 0 |  |
6 | 2 |
|
Guizhou
|
147 | 0 |  |
4 | 2 |
|
Ningxia
|
75 | 0 |  |
12 | 0 |
|
Qinghai
|
18 | 0 |  |
3 | 0 |
|
Tibet
|
1 | 0 |  |
0 | 0 |