What is liquid chromatography?
- Normal Liver Cells Found to Promote Cancer Metastasis to the Liver
- Nearly 80% Complete Remission: Breakthrough in ADC Anti-Tumor Treatment
- Vaccination Against Common Diseases May Prevent Dementia!
- New Alzheimer’s Disease (AD) Diagnosis and Staging Criteria
- Breakthrough in Alzheimer’s Disease: New Nasal Spray Halts Cognitive Decline by Targeting Toxic Protein
- Can the Tap Water at the Paris Olympics be Drunk Directly?
What is liquid chromatography?
What is liquid chromatography? Liquid chromatography (LC) is a chromatographic technique used to separate and analyze the chemical components of a mixture in a solution to determine whether a specific component is present or not, and if so, how much is present.
Many of us will be familiar with the flat LC form from the beginning of school, marking a black ink mark on the filter paper, immersing one end in water, and then observing whether the component colors in the ink are separated. However, most LCs used in analytical applications are based on column chromatography, which will be the focus of this article. As the name suggests, High Performance Liquid Chromatography (HPLC) is a high-performance analysis that uses high chromatographic resolution for efficient separation.
The separated components can also be separated using a fraction collector after detection as a means of purification. HPLC has a variety of different configurations, which can be used to separate the dissolved components of large protein biomolecules with molecular weights ranging from small semi-volatile molecules to tens of thousands of kilodaltons. Liquid chromatography is a very popular analytical technique, widely used in environmental monitoring, agriculture, and medicine.
How does liquid chromatography work?
There are many different system configurations for liquid chromatographs, among which the most efficient separation is performed on ultra high performance liquid chromatography (UHPLC) instruments. This technology was first commercialized in 2004 and is called ultra high performance liquid chromatography ( UPLC). In short, due to the unique distribution of each component between the mobile phase (Figure 1 (1) below) and the stationary phase (column) (Figure 1 (3)), the multi-component soluble in the liquid mobile phase The mixture is separated.
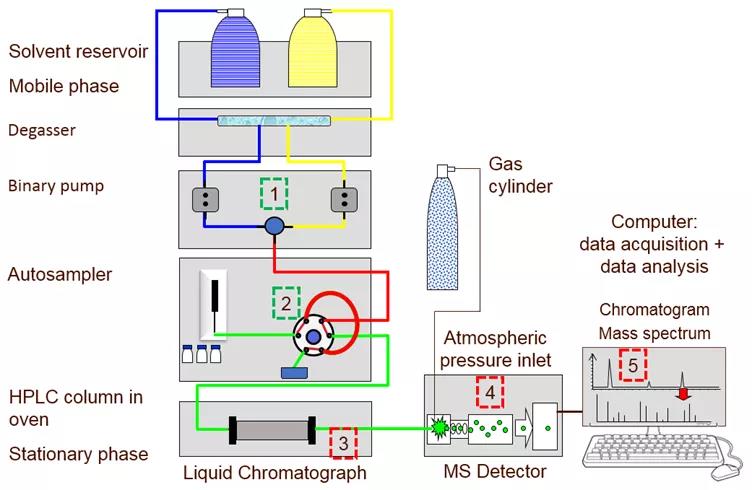
Picture Figure 1: A simplified diagram of a liquid chromatograph connected to a mass spectrometer (LC-MS). (1) Binary pump for mobile phase, (2) 6-port valve and sampler loop of autosampler, (3) Column heater (4) Mass spectrometer detector, (5) PC.
The mobile phase is usually a solvent, and the sample is transported and passed through the system by means of a high-pressure pump (Figure 1 (1)). It also plays a vital role in the separation process.
Load a small amount of sample (1-100 µL) into the sample loop (Figure 1 (2)), and then inject it into the mobile phase through a six-port valve, which will trigger the start of the chromatography. After sample injection, pump the mobile phase into the chromatographic column (Figure 1 (3)). There are a variety of column lengths (30 to 250 mm) and inner diameters (1 to 4.6 mm) to choose from, filled with stationary phase adsorption materials of different activities and particle sizes (1.5 to 10 microns in diameter), which together determine the column’s Efficiency and selectivity. The column is located in the oven. At higher temperatures (45ºC), the viscosity of the mobile phase decreases, thereby increasing its linear velocity. In turn, the running time is reduced and the chromatographic resolution is improved.
The components in the mixture that have a higher affinity for the mobile phase will quickly migrate through the chromatographic column, with almost no interaction with the stationary phase. When the band of the component leaves or elutes from the chromatographic column, the detector (Figure 1 (4)) will give a response proportional to the concentration of the component. The time between injection and detection is called retention time. For a given set of chromatographic conditions, the retention time of the components will be very clear and can be compared with the identification standards.
In reversed-phase chromatography, analytes with less polarity are preferentially distributed to non-polar stationary phases and have longer retention times. The data acquisition system (Figure 1(5)) records the detector response as a function of retention time in the chromatogram. The peaks recorded in the chromatogram (Figure 2 below) are usually integrated to determine the peak area, which is proportional to the concentration of the components present in the sample.
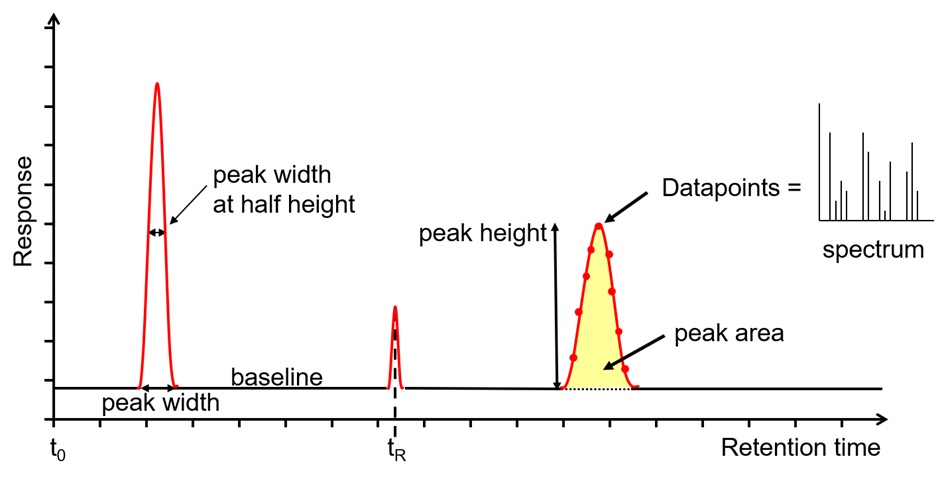
Figure 2: Chromatogram output of HPLC or LC-MS.
After the autosampler injects the sample into the mobile phase, the separation process is performed on the chromatographic column. The selectivity of the chromatographic system has the greatest impact on the chromatographic resolution and should be customized for the application and component under study. The selectivity can be changed by changing the electrochemical strength of specific chemical functional groups in the mobile phase (different solvents) or stationary phase (changing the column type).
Considering the mobile phase, there are two main operating modes to choose from when operating a liquid chromatograph, namely isocratic or gradient. The isocratic method will use the same mobile phase composition during the chromatographic run with no change in selectivity. The gradient method will change the composition of the mobile phase over time, and it can usually be optimized to increase chromatographic resolution or shorten the run time.
The chemical nature of the stationary phase fixed in the chromatographic column will affect the selectivity of this technique. Reversed-phase HPLC or UHPLC is the most popular system configuration and uses a non-polar stationary phase (such as octadecylsilane (ODS or C18)) and a polar mobile phase (water/methanol). Other reversed-phase stationary phases include octasilane (C8), which is less hydrophobic than C18 and has a correspondingly shorter retention time for less polar analytes. If a chromatographic column functionalized with phenolic substituents is used, this will increase the retention of phenolic components due to its increased affinity.
The pH of the mobile phase has a profound effect on the retention time of ionic components and should be used during method development. The buffer can be used to maintain the pH of the mobile phase two units below the pKa of the ionic component, which in turn converts its dissociation equilibrium to a neutral form. The neutral form of the component is less polar, so its retention time can be controlled.
Normal phase chromatography is another method of liquid chromatography that separates analytes based on their polarity. It was actually developed before the introduction of reversed-phase liquid chromatography, but it is not very popular. The stationary phase is polar in normal phase chromatography and the mobile phase is non-polar. This changes the retention characteristics of the system, and the non-polar components of the mixture are eluted first with the shortest retention time.
Polar analytes have a higher affinity for the stationary phase, followed by a longer elution time and a longer retention time. There are other types of liquid chromatography, including ion chromatography, ion pair, size exclusion, affinity, and the list is endless. In addition to size exclusion chromatography, which can separate analytes based on their size/shape or molecular weight, the other forms of liquid chromatographs mentioned above all use different mobile phase and stationary phase chemistry methods. For a given set of components to be separated, the achievable selectivity and chromatographic resolution are defined by the stationary phase and mobile phase used.
Once the components are separated, they need to be tested. The choice of detector is driven by the method objectives of the application; various options have varying degrees of sensitivity, specificity, selectivity, and linear dynamic range. The most popular detector is the ultraviolet visible (UV-Vis) detector, which measures the absorbance of light at a specific wavelength.
The wavelength is selected according to the lambda maximum of the component to be analyzed, and the response of the detector is directly proportional to the concentration of the specific component. As the components elute from the column, their concentration in the flow cell of the detector rises and falls, and then they are plotted as chromatographic peaks (see Figure 2). The data collection rate should be set to collect at least 20 data points in the entire peak. Like many chromatographic techniques,
The length and inner diameter of the pipes used to interconnect the various components of the LC system are critical and should be kept to an absolute minimum. No part of the chromatographic system (not the stationary phase) from the start of the injection loop to the end of the detector flow cell contributes to effective separation. This extra volume in the system is called the void volume, and the additional longitudinal diffusion of the separated components in the void will result in loss of sensitivity and reduced chromatographic resolution.
The evolution from HPLC to UHPLC
The development of UHPLC is partly due to the increasing demands of analysts for higher resolution separation of increasingly complex and challenging samples. The main breakthrough to make the chromatographic performance change at this stage is the development of sub-2 micron stationary phase packing with narrow particle size distribution.
The new particles produced have the same chemical functions as commonly used HPLC stationary phases, ensuring that the selectivity of the chromatographic system is maintained when the same mobile phase is used. When using new sub-2 micron packaging materials, the increase in efficiency or the increase in the number of plates achieves significant performance advantages.
There are many advantages when migrating HPLC methods to UHPLC systems, including shorter run times, higher chromatographic resolution, higher sensitivity, and lower solvent consumption. In order to use the new UHPLC column, a pump that can operate at a higher pressure must be used to accommodate the increased back pressure exerted by the smaller particles in the column. The detector flow cell also needs to be upgraded to have a smaller internal volume, which is necessary for the detection of narrower bands of components eluted from the column. It is also necessary to increase the data collection rate accordingly to ensure that there are enough data points between the peaks.
Liquid Mass Spectrometry (LC-MS)
Mass spectrometry can be said to be the best detector that can be used in conjunction with a liquid chromatograph, because it has high sensitivity, linear dynamic range, selectivity and even specificity when using instruments with very high-quality resolution capabilities. Mass spectrometry technology is used to determine the mass-to-charge ratio (m/z) of a component or analyte. Unlike gas chromatography-mass spectrometry (GC-MS), the process of combining liquid chromatography systems with mass spectrometry is not easy, and it takes many years of development time. Electrospray ionization (ESI) is the most commonly used ionization technique in LC-MS today, where the ionization process is carried out under atmospheric pressure. It is difficult to reach the high vacuum atmospheric pressure inlet required by the mass spectrometer system.
How to read LC-MS mass spectra and what does it tell you?
Electrospray ionization is a very soft ionization technique, which means that very few fragments are observed during ion formation. For basic analytes that generate protonated molecules [M+H] +, you can run in positive ion mode, and for acidic analytes that generate deprotonated molecules [MH] -, you can run the LC-MS system in negative ion mode .
It is possible that fragment ions are generated by the electrospray process, usually by collision induced dissociation (CID), to obtain identification information for characterization or target analytes. CID can be performed in the ion source by changing the potential difference applied to the first sampling cone or the skimmer cone, or it can be performed in the collision cell by accelerating the ions into a collision gas such as argon.
Figure 3 below shows a full-scan LC-MS acquisition, where in-source collisions cause dissociation, resulting in a series of characteristic fragment ions for each separated component of the mixture. The mass-to-charge ratio (m/z) is plotted along the x-axis, and the intensity or relative abundance of ions is plotted along the y-axis. The z-axis in Figure 3 represents the retention time of the separated components. Each baseline analytical chromatographic peak is analyzed once with a mass spectrometer. The key diagnostic fragment ions can be used for identification and target ion confirmation.
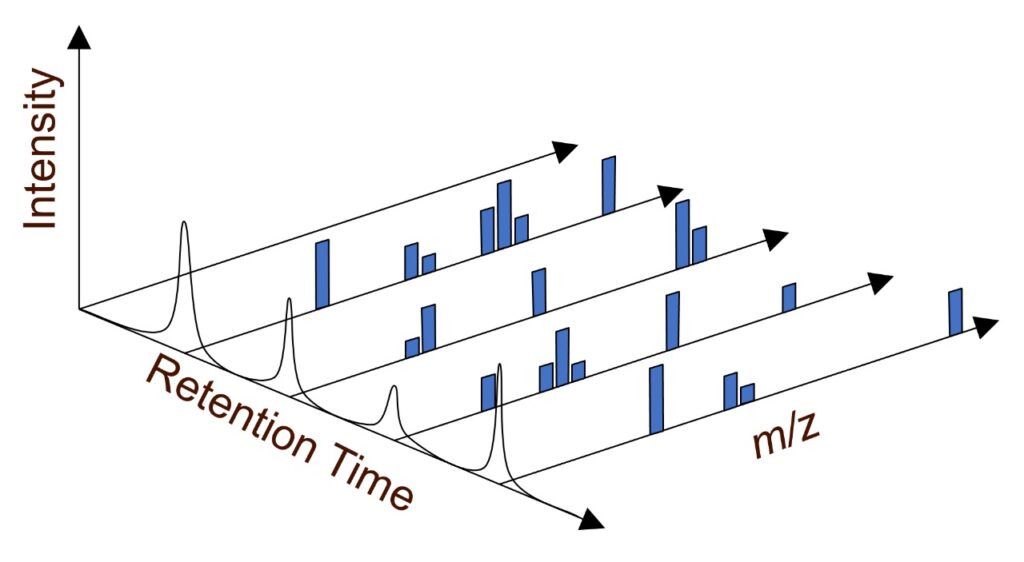
Figure 3: Full-scan LC-MS mass spectrum, MS adds an additional dimension of information.
Incorporate liquid chromatography into multiple dimensions
When dealing with complex multi-component mixtures, it may not be possible to resolve each component at a baseline because individual peaks elute from the column. If chromatographic resolution cannot be provided due to lack of selectivity, method development and optimization can only help you solve the problem, and it may be necessary to use other selective columns to separate co-eluting components.
Multi-dimensional chromatography allows co-eluting components to be transferred to another chromatographic column with more appropriate selectivity through the “heart-cutting” method, so that the separation can be split into individual eluting components. The system can be provided with a transfer valve that simply transfers the co-eluting peaks in the first dimension or the chromatographic column after detection to the second dimension for subsequent separation and higher chromatographic resolution detection.
Semi-preparative liquid chromatography purification
By expanding the size of the liquid chromatography system and using a column with a larger inner diameter and running at a higher flow rate, more materials can be loaded onto the column. The semi-preparative chromatography system may contain 100 mg of sample. Then use a fraction collector to elute the chromatographic peaks from the column and collect them in a separate sample bottle. The fraction collector is triggered by the detector. The detector looks for the inflection point indicating the beginning of the peak in the chromatographic baseline, and then collects the peaks of the separated components as pure fractions. Then the separated fractions can be supplemented with other analysis techniques of mass spectrometry, such as nuclear magnetic resonance (NMR), to fully characterize the structure of the compound.
Advantages and disadvantages of liquid chromatography
LC is commonly used in various applications. However, it is not suitable for the separation and analysis of volatile compounds. A reliable analytical liquid chromatography method can only be achieved when the vapor pressure of all components to be separated is lower than the vapor pressure of the mobile phase. Gas chromatography is more suitable for the analysis of volatile compounds.
Provide a variety of different chromatographic columns and solvents, which can provide a wide range of selectivity, which can separate components with a wide range of polarities. Large molecules and small molecules are equally applicable to this technique. The ability to perform effective separations at relatively low temperatures also makes LC an ideal separation technique for thermally unstable compounds that can be decomposed in a gas chromatograph.
Frequently Asked Questions about Liquid Chromatography
Sample preparation is the key to success; it is very important that all samples must be filtered before they are loaded into the autosampler. When using UHPLC, if the sample is not filtered, the use of sub-2 micron particle chromatographic column for high-efficiency separation is prone to clogging, which is particularly important. This is also true for the mobile phase, especially if a buffer is used.
It is very important to use the correct injection solvent or diluent for the sample, and the strength of the solvent should be equal to or less than the strength of the starting conditions of the mobile phase. If a solvent that is too strong is used, peak splitting and poor reproducibility will be observed. If the cleaning solvent used in the autosampler is too strong, similar problems may be observed.
The baseline fluctuation or poor reproducibility of retention time of the acquired chromatogram is likely to be caused by a problem with the pump (Figure 1 (1)) or the vacuum degasser. If the pump or vacuum degasser is improperly maintained, the check valve may be partially stuck, causing pressure fluctuations. These issues can be resolved by ensuring that preventive maintenance tasks are performed in accordance with the manufacturer’s guidelines to prevent unplanned downtime and poor performance.
(source:internet, reference only)
Disclaimer of medicaltrend.org