Commercial Development of downstream processes for lentiviral vectors
- Gut Bacteria Enzymes Offer Hope for ABO Universal Blood Transfusions
- Well-Known Japanese Medicine Exposed for 30 Years of Data Falsification
- Oregon Reverses Course: From Decriminalization to Recriminalization of Drug Possession
- Why Lecanemab’s Adoption Faces an Uphill Battle in US?
- Yogurt and High LDL Cholesterol: Can You Still Enjoy It?
- WHO Releases Global Influenza Vaccine Market Study in 2024
Commercial Development of downstream processes for lentiviral vectors
Commercial Development of downstream processes for lentiviral vectors. The interest in lentiviral vectors (LVs) in gene therapy applications has increased significantly, but it is difficult to reach the later stages of clinical trials. The main challenge remains to scale up the production process of the vector to obtain high titers for in vivo use.
This article mainly introduces the expansion of LVs production to iCELLis500, which can produce up to 180L of harvest material in one filling. The purification and concentration of the product have been studied to meet the potency and purity requirements for clinical use.
We start with clarification, buffer exchange and concentration, followed by a purification process using single membrane anion exchange chromatography and the final formulation with tangential flow filtration. By comparing different materials and conditions to optimize the process, especially for the chromatographic step, this is the bottleneck of the scale-up of lentiviral vector purification.
The final infectious titer of the lentiviral vector product produced using the optimized scale-up process was determined to be 1.97×10⁹ (TU)/mL with high titer.
1. Overview of downstream development process
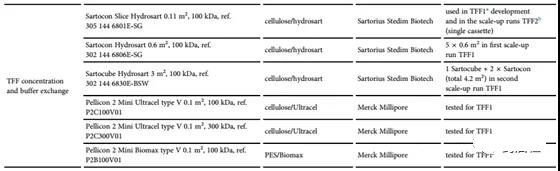
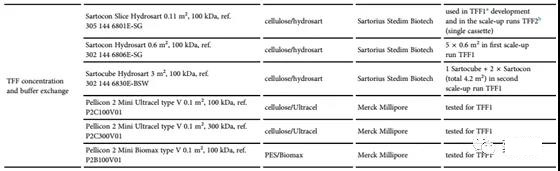
The upstream production of LV was optimized before and partly at the same time as the downstream development. The vector with the GFP transgene was used in the first batch of production, including the first batch of expanded production, to facilitate the use of flow cytometry for functional titration. To clarify, TFF and AEX support selection (Table 1) and pre-screening of the main parameters (Tables 2 and 3) are mainly carried out using these running LV materials.
List of materials used in this experiment:
In subsequent runs, we moved to LV-TK production and used qPCR-based titration. Functional recovery is essential to assess the success of the purification step. However, the total viral particle (vp) recovery rate based on p24 ELISA is still a fast, non-cell-based method that can quickly detect the overall LV recovery rate of the process steps [18].
The comparison between vp concentration and transduction units (TUs) also revealed a loss of activity during the processing step. In the small-scale process development process, not all experiments were performed to analyze the total amount of physical lentiviral particles by p24 ELISA. In this case, only TU promoted this research. The complete DS process is shown in Figure 1.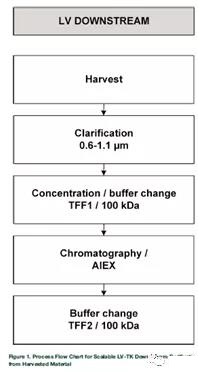
The first large-scale operation (iCELLis500/100 m2, LV-GFP) was carried out to obtain a uniform and concentrated upstream LV raw material to further optimize the DS process. The entire process from upstream production to the final product has undergone a second large-scale operation (iCELLis500/333 m2, LV-TK). The main development results of DS are introduced step by step in each corresponding section, and large-scale operations are evaluated as a separate process to evaluate the success of scale-up.
2. The specific process of downstream development process:
2.1 Clarification steps
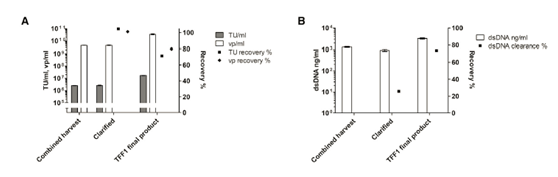
Two different depth filters were tested for clarification: Sartopore 2 and Millistak + Pod (Table 1). The double-stranded DNA (dsDNA) clearance rate of Millistak+ with a larger pore size is not as good as that of Sartopore with a smaller pore size. However, the products recovered through Millistak+ are higher in terms of function (TU) and total vps (determined by p24 ng/mL data; data not shown). Therefore, for the sake of clarification, a filter with a larger pore size that retains better infectivity was selected.
The importance of filter flushing after harvest was also evaluated. Rinse the filter once with a buffer approximately equal to the void volume of the filter, resulting in a 60% increase in vp recovery. The clarity of the Millistak+ filter was tested in several small-scale LV clarity (220-440/m2). The recovery rate of functional particles reached 75%-90% repeatedly, and the total particle recovery rate was about 100. % (Figure 2A).
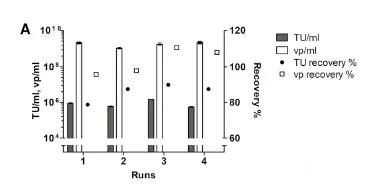
Due to the fragile nature of LV, the recovery rate of functional particles during processing may be reduced. However, in general, the ratio of total physical particles to functional particles decreases toward the final product, which indicates that the quality has improved after the purification process.
2.2 TFF1 concentration and buffer exchange
The clarified material is concentrated and diafiltered into a suitable chromatographic buffer in the tangential flow filtration step, denoted as TFF1. Encapsulated carriers are extremely susceptible to loss of functionality due to the rupture of the envelope caused by foam, shear, pressure changes and aggregation during processing. We optimized the parameters of the concentration and buffer exchange steps to maintain an appropriately high cross-flow to minimize clogging and product accumulation.
2.2.1 Selection of ultrafiltration membrane materials
PES membrane has a more open structure than cellulose membrane, and it has higher permeability than cellulose membrane with the same cut-off value. Compared with the cellulose-based membrane with the same cut-off value, a small-scale experiment showed that the TMP on the PES membrane increased faster (Figure 2B). There is no significant difference in the recovery rate between the two membrane materials (data not shown); however, the hydrophilicity of the cellulose membrane leads to a decrease in the tendency to bind hydrophobic fouling [20], considering the increase in TMP in large-scale processing Affected, the cellulose base film was selected for scale up.
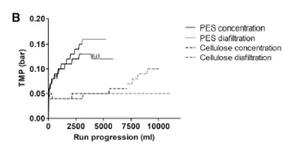
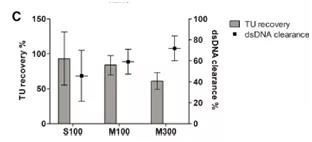
After deciding on the membrane material, two different cut-off values (100 kDa and 300 kDa) were tested using a cellulose-based membrane package. The 100kDa membrane packs of two different brands (Sartoius Slice, Sartorius and Pellicon2, Milllipore) were compared, while the 300kDa membrane pack was only used as Pellicon 2. The 300kDa cut-off value resulted in dsDNA clearance higher than 100kDa; however, the titer recovery rate was low In a smaller membrane package (Figure 2C). The results showed that although the standard deviation (SD) of the results was high, the recovery rate of functional particles of Sartocon’s two 100 kDa membrane packages was slightly higher. Therefore, the Sartocon Slice 100-kDa membrane package was finally selected for amplification.
2.2.2 Optimization of TFF parameters
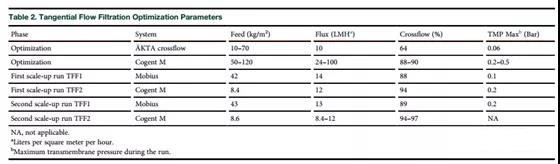
ÄKTAcrossflow (GE Healthcare) and Cogent M (Millipore) with 100 kDa, 0.1 m2 Sartocon membrane package were used to determine the parameters of the TFF1 step on a small scale. The Cogent M parameter produces the lowest TMP value under the control of 24L/m2/h (LMH) flow and 88% cross flow and permeate flow. A flux of up to 100 LMH was tested, and a higher flux resulted in an increase in TMP (Table 2). Generally, the feed load in TFF1 is about 60 kg/m2; however, recovery rates as high as 100 kg/m2 can also be used (recovery rate is about 75%, expressed in functional units).
Parameter range for titer optimization
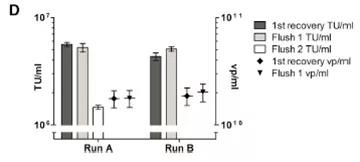
At the end of the TFF process, the product is recirculated on the membrane with the permeate closed (100% cross-flow) to separate the layer formed on the membrane and flush it into the retained product. The effect of reddening the TFF1 membrane after the retentate was tested was tested (Figure 2D). Note that the first flush increases the product recovery rate by approximately 55% of TU. However, the second flushing does not effectively increase the recovery rate.
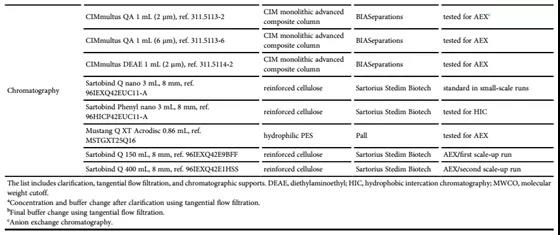
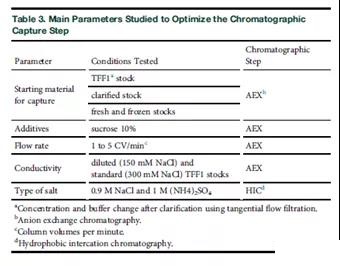
2.3 Capture chromatogram
The development of AEX chromatography began to focus on the two main carrier types (monolithic column and membrane). Several chromatographic analyses were performed to screen the best carrier and conditions (Tables 1 and 3).
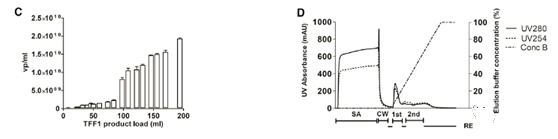
The overall performance of weak anion exchangers and strong anion exchangers are compared. Although the use of weak exchangers may give better resolution, their recovery rate is lower, so only strong exchangers are selected for further evaluation. Both membranes and monoliths can effectively bind lentiviral particles and TFF1 products in the purified harvest, but MustangQ XT hybrids seem to cause a higher flux of TFF1 material (Figures 3A and 3B).

In the case of a linear gradient of the TFF1 substance, the column elution phase usually shows two main peaks with different UV curves (280 milli-absorbance units [mAU] vs. 254 mAU, the elution curve from Sartobind is shown in Figure 3C).
In Figures 3A and 3B, the first peak collection is 16%-22% of the total elution volume. Figure 3D-3F shows the further analysis of the chromatographic peak and impurity removal rate obtained using TFF1 stock solution.
Load the sample at a flow rate of 1 column/membrane volume (MV) per minute, and load each supported volume of raw material volume. The higher flow rate in the ÄKTA Avant 150 device (GE Healthcare) shows that in the column bypass mode, the system loses up to 20% of the vps infectivity at a rate of 5 mL/min, which is related to fragility.
The first elution peak that eluted immediately after the conductivity started to increase was the fraction containing most of the intact virus (Figures 3A and 3B). The recovery rate of TU during elution is particularly low, and only up to 30% of the functional LV bound to the column is eluted with TFF1 material, with a gradient of up to 1.5 M NaCl. The remaining presumed carrier was removed with 0.5M NaOH in the in-situ cleaning step. We also compared chromatography with and without sucrose (TFF1 product) in the raw material. It has been shown that sucrose can increase the stability of lentiviral vectors when frozen [21]. However, no improvement in the TU recovery rate was found, so no additives were used in subsequent runs (data not shown).
dsDNA is mainly present in the second peak, in which some functional particles are also eluted (Figure 3E). For the first peak, both dsDNA and total protein clearance were high (Figure 3E and 3F). After chromatography, the highest quality carrier preparation was eluted from the Sartobind Q membrane (Figure 3D). The vector quality is inversely proportional to the ratio of total vps to TU: the smaller the value of vp/TU, the higher the vector quality.
During the chromatographic process, an increase in pre-column pressure at higher flow rates was observed. In the overall situation, the problem is more serious. A monolithic column with a larger pore size (6mm vs. 2mm) was also tested, but the lower binding capacity is still lower than the recovery rate of Sartobind Q membrane. The high dsDNA levels in the concentrated TFF1 stock solution may be partly responsible for these problems, indicating the importance of optimizing the endonuclease step before further DS processing. After comparison, SartobindQ membrane carriers were selected for further process development and scale-up because they consistently provide the best recovery rate while minimizing technical problems.
Compared with Tris-based buffers (acid dissociation constant [pKa] 7.6 and Tris pKa 8.1 at 25, the negative 10 logarithm of HEPES), it has a higher buffering capacity at physiological pH, so HEPES was chosen Buffer as TFF1 and chromatography buffer C) and Trisbased buffer high temperature dependent pH variability [22]. In order to minimize aggregation and maintain column capacity by excluding some protein binding during sample loading, a buffer containing 300 mM NaCl was selected for column equilibration/loading and washing. By comparing the standard TFF1 raw material (29.2 mS/cm) with the diluted TFF1 raw material (14.6 mS/cm), the influence of the buffer conductivity was tested on the Sartobind Q column.
In addition, we tested the stability improvement effect of adding 10% sucrose to the TFF1 buffer in the chromatographic step. At low conductivity (23.4% TU at 29.2 mS/cm, 21.2% TU at 14.6 mS/cm), no significant improvement in carrier recovery rate was obtained. The addition of sucrose resulted in a decrease in recovery rate (10.4% TU). This is most likely due to an increase in viscosity during operation. The standard TFF1 buffer (300 mM NaCl) was selected for further development to minimize the incorporation of impurities.
2.4 Research and stability of final formulation buffer
The final formulation of the viral vector formulation can significantly affect the stability of the product, especially for fragile LV, the formulation should not only support the preservation of the product, but also should be used in vivo. Sucrose and magnesium chloride are used in the final formulation of LV to increase the stability of the product during storage [21,23,24]. In several buffers based on HEPES and PBS, the stability of LV was studied.
The short-term storage results are consistent; the most effective buffer to maintain the short-term stability of LV at 80°C is 10% sucrose in 50% HEPES, 20 mM MgCl2 in PBS, 5% sucrose in 50 mM HEPES, 20 mM MgCl2 and 50 mM HEPES. The performance of these buffers is significantly better than the standard PBS (Figures 3G and 3H; 0 hour samples). In addition, 10% sucrose in 50 mM HEPES and 20 mM MgCl2 in PBS may be considered better than only 50 mM HEPES.
During incubation at room temperature, none of the buffers can prevent a significant decrease in titer (Figure 3G; 6 h and 24 h samples). Between 0h and 24h, all samples are statistically different. However, the most stable FFBs at room temperature are 5% sucrose 20 mM MgCl2 in 50 mM HEPES, 50 mM HEPES and 20 mM MgCl2 in PBS. After 6 hours of incubation, 65%, 68% and 77% of the carrier were retained, respectively. After 24 hours, only 27%, 18% and 8% remained (Figure 3G).
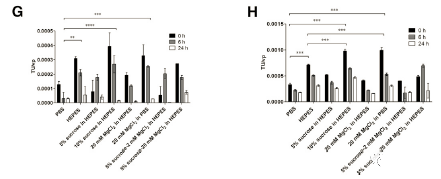
When LV was incubated at +4°C, a minimal reduction in titer was observed in 50 mM HEPES, PBS and 5% sucrose in 50 mM HEPES 5% sucrose-20 mM MgCl2 (Figure 3H; 6 h and 24 h samples). After 6 hours of incubation, 82%, 67% and 71% of the activity remained, respectively. After 24 hours, the remaining activities were 59%, 55%, and 50%, respectively. However, from the initial 0-h titration point to the 24-h titration point, the titer is significantly reduced, which indicates that FFB cannot maintain stability at +4°C.
For scale-up experiments, we combined the significant cryopreservation effect observed with 10% sucrose in 50 mM HEPES and 20 mM MgCl2 in PBS to the final formulation buffer, 50 mM HEPES + 20 mM MgCl2 and 10% sucrose ( pH 7.5). After 1 year and 2 years of storage at 80°C, the final product (LV-TK) of the second amplification run was re-analyzed and the functional units were normalized to the total vps (vp/TU). During storage, the vp/TU ratio seems to remain similar, from 3.46 103 vp/TU at 0 time point to 4.29×10³ vp/TU at 1 year time point and 2.81×10³ vp/TU year time at 2 time points point.
2.5 Clarification and TFF1 for the first scale-up run
In the first large-scale clarification, the feed rate and flux were reduced to 215kg/m2 and 146 LMH, respectively, to ensure effortless scale-up. 126.8 kg of the 168.8 kg clarified product was further processed in TFF1. Use small-scale optimization parameters as a guide for TFF1. In order to ensure the operability of scale-up, a lower feed load (42 kg/m2) was used than in the small-scale experiment. During operation, TMP increased to 0.1 bar (Table 2).
In the first large-scale operation, the product was not recycled before being recovered. However, flush the system like a small-scale experiment and combine the first flush with the initial recovery rate to form the final TFF1 product. The second and third washes did not improve the recovery rate, thus confirming the results of the small-scale experiment (data not shown). In the clarification step, the recovery rate of functional particles and vp is close to 100%, in the TFF1 step, the recovery rate is close to 70%-80% (Figure 4A). The clarified dsDNA clearance rate was 25%, and more than 65% of the remaining dsDNA was removed in the TFF1 step (Figure 4B). However, due to the volume concentration in the TFF1 step, the dsDNA concentration in the TFF1 product is higher than the concentration at harvest.
2.6 Chromatogram optimization and the chromatogram of the first scale-up run
Before scaling up the chromatography and final formulation, the obtained large-scale TFF1 product is used to further optimize the chromatography steps. First, the elution is improved, and the linear gradient from 0% to 100% is converted into a shallower solution of 0% to 60%, aiming to better separate nucleic acid from virus-containing components. For Sartobind Q, a breakthrough curve based on total vps was obtained, and the frozen TFF1 inventory was expanded for the first time. The 20% breakthrough point was determined at 2.06×10¹² vp (Figure 4C).
The AEX chromatographic step is planned to be a 50x intermediate magnification from Sartobind Q nano (3 mL) to a 150 mL version with the same membrane support and bed height. The total particle concentration of the large-scale TFF1 product was determined to be 2.23×10¹⁰ vp/mL. In order to keep the total particle load below the 20% breakthrough point, 4.3 kg of frozen and thawed TFF1 product was loaded into the chromatographic column.
The full chromatogram is shown in Figure 4D, and the collected fractions are underlined.
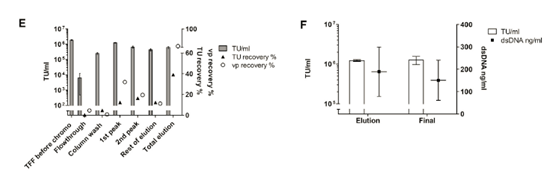
Figure 4E summarizes the results obtained.
When considering the total particles, the vp recovery shows the expected pattern, with the first peak containing the largest amount (32.0%). However, the recovery of functional viruses in the same proportion was only 12.4%. The reason for this result cannot be determined. The mass balance indicated that during the small-scale elution, most of the viral vectors were not recovered from the chromatographic column (total vp recovery rate was 62.8%), and all the infectious LV-GFP vectors eluted were 39.2%.
The second peak contains most of the eluted dsDNA (25.7% for the first peak and 1.6% for the first peak; data not shown) and also 16.4% of the recovered TU. This, together with the vector recovered in the remaining elution fractions, points out the difficulty of accurately manually separating the viral peak from this linear gradient. In the next large-scale experiment, the elution plan was changed to gradient elution. All in all, this processing step provided a major dsDNA impurity removal rate (over 98%), but it did not help to concentrate the LV-GFP vector.
2.7 Use further optimized parameters for the second large-scale operation
In the second large-scale operation (LV-TK), continuous downstream processing from clarification to final formulation (Figure 1). The main improvement downstream is the conversion of AEX linear gradient elution into three independent steps (elution buffer concentration of 12%, 30% and 45%), and the use of a larger Sartobind Q column (400 mL). A harvest of 178.4 kg was obtained, clarified, and conditioned into TFF1 buffer to recover 15.59 kg of concentrated LV-TK vector. The recovery of TFF1 based on functional titers and physical particles is very good (Figures 5A and 5B). In the TFF1 step, approximately 70% of the protein and dsDNA were removed (Figure 5C). Compared with the first, the total dsDNA concentration of the harvest in the second amplification run was lower (Figure 5D); however, the gap in the TFF1 step between the two runs was similar.
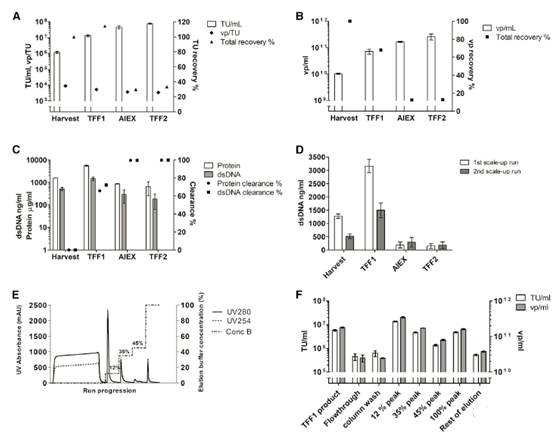
Load a total of 11 kg into the AEX column (Figure 5E). According to the expected productivity and chromatographic magnification (30 mL TFF1 per milliliter of membrane carrier), determine the breakthrough and maximum load of the chromatogram (initially estimated at 2×10¹² vp/mL membrane breakthrough). Since in the large-scale operation, the vp production rate was higher than that of the first large-scale operation, an excess of virus was loaded per milliliter of membrane (5×10¹² vp/mL membrane), resulting in higher losses than expected.
However, in the second large-scale operation, the virus recovery rate was significantly higher, and there were 22.4% of functional LV vectors in the product fraction (stepped peak 12%). As expected, the other elution fractions did contain some functional virus, resulting in a total elution recovery of 33.1% of the vector (Figure 5F).
Purification factors (measured by total protein and dsDNA clearance) were obtained in the TFF1 and chromatographic steps (Figure 5C). The dsDNA level in the final product is similar to the first scaled-up LV-GFP product, which is 150.8 ng/mL and 182.5 ng/mL in the first and second scaled-up products, respectively. However, the optimized endonuclease treatment performed before clarification in the second amplification run is clearly more effective (Figure 5D).
In the TFF2 step, similar to the first run, the main virus fraction (12% step) was processed to make the product into the final buffer. The total volume of the obtained LV-TK vector was 570 mL, and the titer based on HeLa cell transduction and subsequent qPCR was 7.60×10⁷±4.98×10⁶ TU/mL (±SD) (Figure 5A). The external analysis result of C8166 cells showed that the functional titer was 1.97×10⁹TU/mL, so the total output was 1.12×10¹² TU. External analysis also confirmed that the final product does not contain replication-competent lentivirus.
3 Discussion
Lentiviral vectors are an increasingly popular alternative method in gene therapy [1]. However, there are still few large-scale LV manufacturing methods required for clinical trials and commercial use [11]. In our parallel study [10], we expanded the production scale of LV to the iCELLis 500 bioreactor, which can produce up to 180 L of LV stock solution (perfusion).
Before downstream optimization, upstream process optimization and scale-up are required to provide consistent raw material availability for downstream development to ensure repeatability. In this research, we developed and optimized the LV purification and concentration program to obtain high-titer purified LV products. Most scalable LV DS schemes follow standard outlines, including filtration and chromatography [25].
We start downstream processing by clarification on a microfiltration scale, then concentrate and replace the buffer, use TFF, anion exchange chromatography for purification, and perform appropriate chromatographic separation. The final formulation is put into storage buffer with TFF. The DNA digestion step in our protocol takes place in the upstream harvest.
In the clarification step, the recovery rate of functional particles is always maintained between 75% and 90%. The TFF step before purification by chromatography is necessary to reduce the impurity load of the raw materials in advance and change the buffer to a solution more suitable for anion exchange chromatography. For the concentration and diafiltration of TFF, due to the slightly higher recovery rate of functional particles, we chose a 100 kDa column instead of a 300 kDa column.
In chromatography, we passed several membrane-based and monolithic carriers for screening [18]. After the pre-screening, Sartobind Q membrane-based chromatographic columns were selected for further optimization because they obtained the highest recovery rate of functional units from concentrated materials. Finally, the trade-off between recovery rate and impurity removal must be carefully selected according to the other downstream steps included in the process in order to obtain a high-quality final product.
In the final TFF step, we change the buffer to the final formulation buffer for storage. We combined the cryopreservation effects of sucrose and MgCl2 into a 50mM HEPES, 20mM MgCl2 and 10% sucrose formula. The sterility of the final product is usually achieved through the final aseptic filtration step; however, in the final LV aseptic filtration, we lose approximately 30%-50% (data not shown). In our case, we used TFF1 and TFF2 buffers that had been cooled to +4°C before starting the process.
In some results, we achieved a recovery rate of more than 100% of TU. Impurity levels have been shown to affect the transduction and cryopreservation of retroviral vectors [12] and LV [29]. It must be noted that the analytical method for the titration of functional lentiviral vectors is still very complicated. Even if the same cell type is used in different laboratories, different results can be obtained [18,30].
The second optimized scale-up of the downstream processing of 180 L LV-TK produces a final product of 570 mL, and the internal qPCR-based functional titer is 7.60 107±4.98 106 TU/mL (±SD, HeLa cells). However, the titer obtained by external qPCR analysis was 1.97×10⁹ TU/mL (C8166 cells), and the total yield was 1.12×10¹² TU.
Compared with functional particles, the physical particle mass of the product is 3.5×10³ vp/TU, which is equivalent to the LV mass obtained in other large-scale production [14,17]. The dsDNA removed from the upstream harvest during downstream processing was 99.8%. In addition, in the two scale-up experiments, there was no significant difference in the final titer and dsDNA concentration, which confirmed that the transgene did not seem to change downstream requirements.
The current LV titer required for clinical trials is about 1-5×10⁹ TU/mL [33,34]. If the final product obtained here is sterile filtered and the functional unit is lost by 50%, the product (about 1109TU/mL) is sufficient to meet the 600 mL dose of about 950 doses, each with a dose of 5.91×10⁸ TU.
Future research considering downstream development should focus on improving the chromatographic step, which is still the bottleneck, and the downstream step has the lowest recovery rate. In short, large-scale purification and concentration of LV products is feasible, and with relatively small modifications, the method described here can be transferred to the current environment that meets good manufacturing practices to produce clinical-grade LV.
(source:internet, reference only)
Disclaimer of medicaltrend.org