Nature: T9 CAR-T cells can enhance anti-tumor activity
- Normal Liver Cells Found to Promote Cancer Metastasis to the Liver
- Nearly 80% Complete Remission: Breakthrough in ADC Anti-Tumor Treatment
- Vaccination Against Common Diseases May Prevent Dementia!
- New Alzheimer’s Disease (AD) Diagnosis and Staging Criteria
- Breakthrough in Alzheimer’s Disease: New Nasal Spray Halts Cognitive Decline by Targeting Toxic Protein
- Can the Tap Water at the Paris Olympics be Drunk Directly?
Nature : T9 CAR-T cells can enhance anti-tumor activity
- Should China be held legally responsible for the US’s $18 trillion COVID losses?
- CT Radiation Exposure Linked to Blood Cancer in Children and Adolescents
- Can people with high blood pressure eat peanuts?
- What is the difference between dopamine and dobutamine?
- What is the difference between Atorvastatin and Rosuvastatin?
- How long can the patient live after heart stent surgery?
Nature : T9 CAR-T cells can enhance anti-tumor activity.
Chimeric antigen receptor (CAR) T cell immunotherapy is a promising strategy to improve the treatment results of hematological malignancies [1,2].
In the past ten years, CAR-T cell therapy research and clinical trials have achieved great success [3-6].
Although a variety of CAR-T cells targeting different antigens have been developed, CD19-targeted or BCMA-targeted CAR-T cell therapy has been proven to be effective for relapsed/refractory diffuse large B-cell lymphoma, acute lymphotrophication Cellular leukemia or multiple myeloma is most effective [7,8].
However, even in patients with complete remission in the early stage of treatment, there are still a considerable number of patients who relapse after CAR-T cell therapy [9].
The average overall survival of patients with relapsed or refractory large B-cell lymphoma is 2 years [10].
For patients with acute lymphoblastic leukemia, the median overall survival is only about 19 months [11].
The six-month overall survival rate of patients with acute lymphoblastic leukemia is <80%12.
Reasons for treatment failure include, but are not limited to, loss of antigen from CAR-T cell transfusion [13,14] and poor durability [12].
There are two main reasons for the poor persistence of CAR-T cells: programmed cell death [15] and failure [12].
T cell depletion is a more complex phenomenon than programmed cell death, and may be affected by many factors, such as the initial state of T cells [17], patient age [18] and tumor microenvironment [19].
Recently, We[20-23] and others[24,25] showed that compared with mouse Th1, Th17 or Tc1/CTL, it secretes antigen-specific IL9 (CD4+ Th9 or CD8+Tc9) in mouse tumor models.
T cells are different subgroups with stronger anti-tumor efficacy.
Compared with other subsets of T cells, these subsets express different cytokine profiles, low cytolytic proteins, and failure markers [20-22].
Therefore, we hypothesize that human CAR-T cells polarized in vitro under Th9 culture conditions may be more effective in eradicating established human tumors in vivo than CAR-T cells polarized under traditional Th1/Tc1 culture conditions.
In this work, we provide a method for the polarization and expansion of CAR-T cells. We polarize and expand CD19 or GPC3 CAR-T cells under Th9 conditions.
The results show that, compared with CAR-T cells that secrete IFNγ, CAR-T cells that secrete IL9 show obvious characteristics, including in vivo and in vitro differentiation and lower proliferation ability.
Therefore, these CAR-T cells exert greater anti-tumor efficacy against human acute lymphoblastic leukemia expressing CD19 or liver cancer expressing GPC3 in vivo.
We have previously demonstrated that T cells that produce murine IL9 show strong anti-tumor efficacy and maintain long-term persistence in vivo [20-22].
In order to evaluate whether human CAR-T cells have such characteristics in cultures supplemented with IL4 and TGF-β (Th9 polarization conditions), purified human CD3+ T cells were used with anti-CD3/CD28 magnets polarized in Th9 culture.
Bead stimulation conditions (T9), and then transduction with a second-generation CAR containing single-chain variable fragments (scFv) that recognize human CD19, hinges, and transmembrane CD8, 4-1BB, and CD3ζ intracellular signaling domains. T cells polarized with IL2 were used as a T1 CAR-T cell control [26].
CAR-T cell production process
Vector construction and virus production.
The chimeric immune receptor based on FMC63 scFv, followed by 4-1BB and CD3 intracellular domain was constructed into a lentiviral vector back bone construct, and then CAR based on GPC3 scFv, and then 4-1BB and CD3 intracellular structure The domain is constructed as the backbone of the retroviral vector.
In both vectors, the CAR sequence is followed by 2A and GFP.
Inoculate 293T cells on a 100mm plate, and co-transfect with lentiviral vector plasmid or retroviral vector plasmid, packaging plasmid and TransIT®-2020 Transfection Reagent (Mirus).
The virus supernatant was harvested 60 hours after transfection, concentrated by PEG-it virus precipitation kit (System Biosciences), and stored at -80°C for future use.
CAR-T production and preparation.
Human T cells were isolated from the blood of healthy volunteers after leukocyte removal by negative selection.
T cells were cultured in T cell expansion medium (ThermoFisher) supplemented with 100 U/mL penicillin, 100 mg/mL streptomycin sulfate and 2 mM GlutaMAX, and human T activator CD3/CD28 dynabeads: Cell 3: 1 Perform the following stimulation.
Twenty-four hours after activation, T cells were transduced with the virus. In order to generate classic T1 or Th1/Tc1 CAR-T cells, human CD3+, CD4+ or CD8+ T cells were cultured with recombinant IL2 (Peprotech), added every other day, the final concentration was 100 IU/mL, and the cell density was 0.5× 10⁶-1×10⁶ cells/mL.
In order to generate T9 CAR-T cells, human CD3+ T cells and CD3+ T cells were cultured in the presence of IL4 (10 ng/mL, R&D), TGF-β (1 ng/mL, R&D), anti-IFN-γ antibody (10μg/ml) IL2 (as described above).
Experimental results
First, we defined the hallmark cytokines of T9 CAR-T cells.
After 16 days of in vitro expansion, mRNA was extracted from the sorted CD4+ or CD8+ CAR-T cells.
Real-time PCR results showed that T9 CAR-T cells expressed high levels of IL9 and low levels of IFN-γ, while T1 CAR-T cells expressed low levels of IL9 and high levels of IFN-γ (Figure 1a, b).
Confirmed by flow cytometry analysis (Figure 1c, d, Supplementary Figure 2).
In order to evaluate the cytokines released from CAR-T cells, sorted Th9 or Tc9 CAR-T cells were stimulated by tumor cells expressing the antigen (K562 cells expressing CD19; wild-type K562 cells were used as a negative control).
We observed that exposure to tumor cells can significantly enhance the IL9 produced by Th9 and Tc9, but not Th1 or Tc1 CAR-T cells (Figure 1e). Interestingly, although there are fewer Th1 or Tc1 CAR-T cells, tumor exposure also promotes Th9 and Tc9 CAR T cells to produce IFN-γ.
In addition, the amount of IL2 and TNF-α secreted by Th9 CAR-T cells is lower than that of Th1 CAR-T cells, but the levels of IL2 and TNF-α secreted by Tc9 CAR-T cells are significantly higher than that of Tc1 CAR-T cells, especially in After co-culture with tumor cells.
In addition, compared with T1 CAR-T cells, T9 CAR-T cells secreted much less IL4 and IL10 (Figure 1e). Flow cytometry showed that T cells polarized under T9 showed higher transduction efficiency than T cells under Th1 polarization conditions (Supplementary Figure 1a-c).
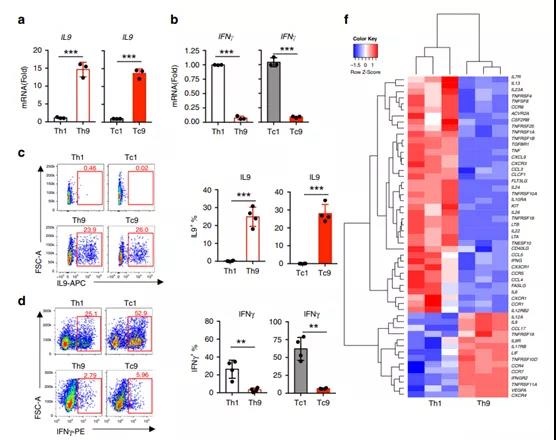
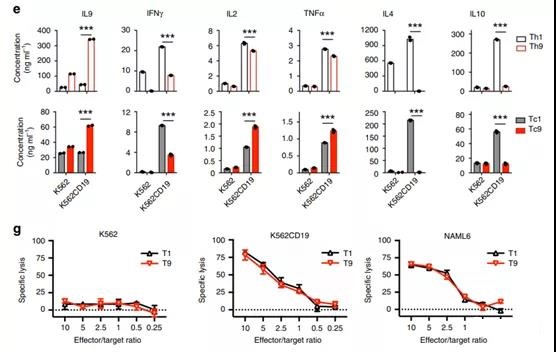
Figure 1. Characterization of T9 CAR-T cell cytokine expression profile. On the 16th day of the in vitro expansion period, CAR-T cells were harvested and analyzed.
- Real-time PCR analysis of the relative mRNA expression of a IL9 (n=4 donors) or b (n=4 donors) IFN-γ in the sorted CD4+ and CD8+ CAR-T cells.
- c Representative flow chart (left panel) and summary data (right panel; n=4 donors) show the expression of IL9 in CAR-T cells. Pre-gating GFP+CD3+CD8+ or GFP+CD3+CD4+ T cells.
- d Representative flow chart (left panel) and summary data (right panel; n=4 donors) show IFN-γ expression in CAR-T cells. Pre-gating GFP+ CD3+ CD8+ or GFP+ CD3+ CD4+ T cells.
- The concentration of cytokine secreted by CAR-T cells classified by Th1 or Th9 (upper image) or Tc1 or Tc9 (lower image) in response to K562 (K562-CD19) tumor cells expressing K562 or CD19.
- The BD Cytometric Bead Assay kit (n = 3 donors) was used to determine the production of the specified cytokines.
- The heat map illustrates the relative expression of cytokines and cytokine receptors in Th9 or Th1 CAR-T cells polarized in vitro. Extract and purify the RNA of CD4+GFP+CAR-T cells for RNASeq.
- g Under the indicated E:T ratio, the percentage of specific lysis of target tumor cells by CAR-T cells as determined by a 24-hour cultured luciferase assay.
We use RNASeq analysis to analyze the transcriptome of human Th9 or Th1CAR-T cells.
Cluster analysis showed that Th9 CAR-T cells have different genetic characteristics from Th1 CAR-T cells.
The volcano map shows that, compared with Th1 CAR-T cells, the differential expression of nearly 1300 transcripts in Th9 CAR-T cells, including 641 up-regulated genes and 608 down-regulated genes (Supplementary Figure 3a, b).
Compared with IL1 and IFN-γ, the characteristics of cytokines, chemokines and their receptors expressed by Th9 CAR-T cells are completely different from those of Th1 CAR-T cells (Figure 1f), which indicates that Th9 CAR-T cells The function of Th1 CAR-T cells is significantly different.
We further examined whether the difference in cytokine secretion affects the killing ability of T9 CAR-T cells.
Cytotoxicity was determined by co-cultivating CAR-T cells and tumor cells with different effector:target cell ratios for 24 hours.
T9 CAR-T cells showed strong cytolytic activity similar to T1 CAR-T cells on target tumor cells (K562 and CD19+ NALM6 cells expressing CD19) (Figure 1g).
The control K562 cells were not observed to be killed.
Human T9 CAR-T cells show strong proliferation ability.
During the in vitro expansion, we observed that the cell size of both CD4+ and CD8+ T cells cultured under Th9 polarization conditions increased, and then decreased cell size at a slower rate than cells polarized under Th1 polarization conditions (Supplement Figure 4), and significantly increased the proliferation ability of Th1 or Tc1 cells (Figure 2a, b). In addition, the proportion of Th9 or Tc9 CAR-T cells stained with the apoptosis marker Annexin V was less than that of Th1 or Tc1 CAR-T cells (Figure 2c).
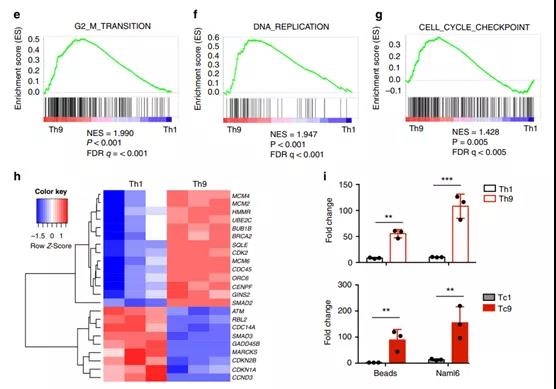
Figure 2 T9 CAR-T cells have a unique hyperproliferation advantage over T1 CAR-T cells.
- The number of viable CAR-T cells determined by the trypan blue exclusion method. Calculate the fold expansion of CAR-T cells from day 0 to day 18. The bars represent the mean ± SD (n=4 donors, two-way ANOVA). b On the 14th day, after first stimulation with anti-CD3/CD28 beads, T1 or T9 CAR-T cells were used for FarRed dilution assay, and the FarRed staining intensity was analyzed 72 hours after staining.
- Pre-gating GFP+CD3+ CD4+ (Th1 or Th9) (left image) or GFP+CD3+CD8+ (Tc1 or Tc9) (right image) T cells.
- The data represents three independent experiments.
- c Representative flow graph (left graph) and summary results (right graph; n=4 donors) of annexin V+ apoptotic CAR-T cells on day 16 of expansion.
- d KEGG cell apoptosis gene, e G2M checkpoint gene, f DNA replication gene and g cell cycle gene marker GSEA results. NES standardized enrichment score, FDR false discovery rate.
- The h heat map illustrates the relative expression of genes involved in G2M checkpoints, DNA replication, and cell cycle regulation. Th1 or Th9 (upper image) or Tc1 or Tc9 (lower image) CAR-T cells cultured with beads or NALM6 tumor cells for 4 days.
In order to understand the mechanisms leading to the reduction of apoptosis and excessive proliferation of T9 CAR-T cells, genes related to apoptosis, cell cycle and proliferation were analyzed by gene set enrichment analysis (GSEA).
The results showed that although Th1 cells have higher transcription levels of genes related to apoptosis (Figure 2d), Th9 cells have higher expression of genes encoding G2/M transition (Figure 2e), DNA replication (Figure 2f) and cells Cycle (Figure 2g).
Heat map analysis showed that the expression of minichromosome maintenance (MCM) transcripts (including MCM2, MCM4 and MCM6) in Th9 cells was much higher (Figure 2h), indicating that the MCM2-7 complex in Th9 acts as a replication helicase 27 .
Cells are functionally different from Th1 cells. In addition, Th9 CAR-T cells are also rich in CDK2 (Figure 2h), which is involved in cell cycle regulation [28].
We set out to evaluate the proliferation ability of T9 or T1 CAR-T cells after exposure to CD19-expressing tumor cells (NALM6 cells).
Anti-CD3/CD28 beads were used as a control. T9 and T1CAR-T cells were co-cultured with designated tumor cells at a ratio of 1:1.
After four days, use CountBright™ absolute counting beads to count gated GFP+ CD3+ CD4+ (Th9) or CD8+ (Tc9) CAR-T cells. Th9 and Tc9 CAR-T cells both showed strong proliferation ability in culture with anti-CD3/CD28 beads or NALM6 cells, at least 5 times higher than their corresponding Th1 and Tc1 CAR-T cells (Figure 2i).
T cells.
Based on the difference in cytokine profile and proliferation ability, we hypothesize that T9 CAR-T cells and T1 CAR-T cells have different differentiation states.
In order to accurately characterize the differentiation status of Th9 CAR-T cells, we performed GSEA on RNASeq data again. Interestingly, genes involved in central memory (Tcm) cells were significantly enriched in Th9 CAR-T cells (Figure 3a), while genes used in effector memory (Tem) cells were significantly enriched in Th1 CAR-T cells. Set (Figure 3b).
These results were confirmed by flow cytometry to examine the expression of CCR7 and CD45RO on CD4+ and CD8+ T cells after 16 days of in vitro expansion.
Compared with their counterparts, T9 CAR-T cells maintain a higher proportion of CCR7+CD45RO+ Tcm cells, while T1 CAR-T cells have a larger population of CCR7-CD45RO+ Tem cells (Figure 3c, d).
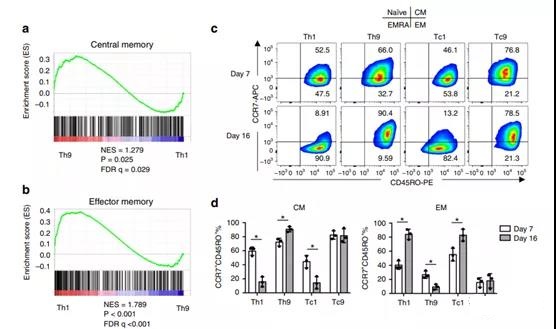
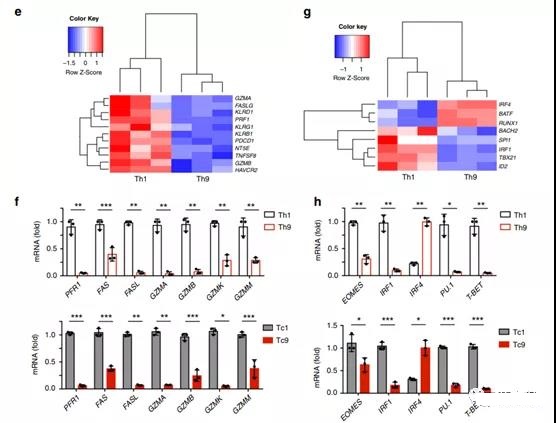
Figure 3. T9 CAR-T cells produced in vitro show a Tcm-like phenotype and a less exhausted phenotype.
- GSEA results show the central memory or b-effect memory gene signature of polarized Th9 or Th1 cells.
- c Representative flow chart and d pie chart (n=3 donors) show the expression of CCR7 or CD45RO on CAR-T cells on day 7 and day 16. e heatmap, showing exhaustion and cytolytic gene expression in Th9 or Th1CAR-T cells assessed by RNASeq.
- f Exhausted and cytolytic gene expression levels (relative to GAPDH) in CAR-T cells measured by qPCR for Th1 or Th9 (top) and Tc1 or Tc9 (bottom).
- The g heat map illustrates the expression of transcription factor genes in Th9 or Th1 CAR-T cells. h Th1 or Th9 (upper figure) and Tc1 or Tc9 (lower figure) expression levels of transcription factor genes in CAR-T cells (relative to GAPDH) measured by qPCR, performed 3 biological replicates, and the data shown are representative Two independent experiments.
Unlike Tem cells, Tcm cells have unique granzyme production and transcription characteristics [29].
The transcriptional expression of lytic granule protein was compared in CD4+ CAR-T cells.
Human Th9 CAR-T cells express less cytotoxic molecules, such as PRF1, FAS and granzymes (GZMA, GZMB, GZMK, GZMM) (Figure 3e, f), which indicates that T9 CAR-T cells represent the degree of terminal differentiation The lower subset.
The protein level of granzyme B (GZMB) was evaluated by flow cytometry, and the results showed that Th9 and Tc9 CAR-T cells had significantly lower GZMB expression compared with Th1 and Tc1 CAR-T cells (Supplementary Figure 5).
RNASeq analysis showed that compared with Th1 CAR-T cells, Th9 CAR T cells have reduced expression of genes that regulate effector differentiation, such as PU.1 (SPI1), eomesodermin (EOMES), T box 21 (TBX21) and IRF1. Figure 3g , H).
Tc9 CAR-T cells showed similar gene expression profiles to Th9 CAR-T cells (Figure 3f–h). Compared with their counterparts, Th9 and Tc9 cells both expressed higher levels of IRF4 (Figure 3g, h).
We also analyzed the fatigue-related genes of T cells using RNASeq data and found that JUN31, which is reported to induce fatigue tolerance in CAR-T cells, is highly expressed in Th9 but not Th1 CAR-T cells (Supplementary Figure 6a).
To confirm this result, Western blot analysis was performed on Th9 CAR-T cells expanded on the 14th day.
The results showed that Th9 cells not only showed higher c-jun expression at Ser73, but also c jun phosphoric acid. (Supplementary Figure 6b).
Next, in order to determine which cytokine played a major role in shaping the characteristics of T9 CAR-T cells, we polarized CD3+CAR-T cells under four different conditions (None, IL4, TGFβ, IL4+TGFβ) . IL2 was added to all cultures to support T cell survival and growth.
The results showed that TGFβ alone induced the expression and phosphorylation of c-jun (Supplementary Figure 6c) and the expression of CCR7 (Supplementary Figure 6d).
However, TGFβ alone can significantly inhibit cell growth, which can be rescued by adding IL4 (Supplementary Figure 6e). In addition, IL4 reduced the percentage of PD1+TIM3+ population (Supplementary Figure 6f).
Therefore, the properties of T9 CAR-T cells (including IL9 expression) are the result of the combined action of TGFβ and IL4 (Supplementary Figure 6g).
It has been shown that Tcm cells have significantly enhanced breathing ability [32].
Therefore, we checked the oxygen consumption of CAR-T cells. The results showed that compared with Th1 CAR-T cells, the oxygen consumption rate (OCR), maximum respiratory capacity and basal OCR in Th9 were significantly increased (Supplementary Figure 7a–c).
All in all, T9 CAR-T cells express low levels of T cell exhaustion markers (PD-1 and TBX 21) and more CCR7 associated with Tcm cells, indicating that T9 CAR-T cells represent fewer terminally differentiated T cells .
Human T9CAR-T cells show strong anti-tumor activity in vivo.
Given the observed phenotype and proliferation ability of T9 CAR-T cells, we will next investigate whether T9 CAR-T cells have enhanced anti-tumor capabilities in vivo.
NALM-6 tumor cells were injected intravenously into NSG mice, and when tumor burden appeared 7 days later, the mice received 4×10⁶ CD3+ T9 or T1 CAR-T cells through the tail vein (Figure 4a).
Compared with T1 CAR-T cells (Figure 4d), T9 CAR-T cells are more effective in reducing tumor burden (Figure 4b, c) and prolonging the survival rate of tumor-bearing mice.
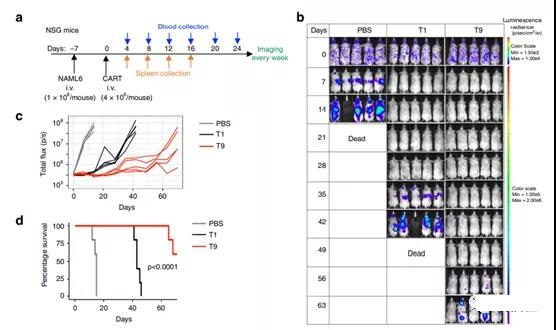
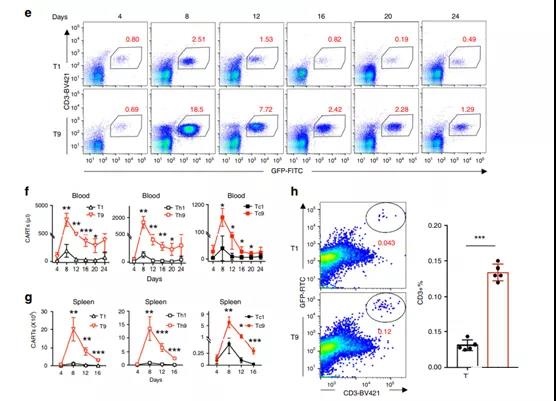
Figure 4 T9 CAR-T cells show enhanced anti-tumor activity against established tumors in vivo.
- 1×10⁶ NALM6 cells were intravenously injected into NSG mice. Seven days later, the mice were randomly divided into three groups, and 4×10⁶ CD3+ CAR-T cells were injected intravenously.
- b. The tumor burden is measured by bioluminescence at a specified number of days after the CAR-T cell injection.
- c The tumor burden (total flux) of mice treated with PBS or CAR-T cells is expressed in photons/second since the specified number of days after CAR-T cell infusion.
- d Kaplan–Meyer chart shows the survival rate of mice. The exact p value of the log-rank test of T1 versus T9 CAR-T cell-treated mice is shown, and the data shown represents two independent experiments.
- e Representative flow chart shows the frequency of CD3+CAR-T cells in the blood of treated mice on day 8 after CAR-T infusion. The total number of CD3+CAR-T cells in f blood (n=5 mice) or g spleen (n=4 days, n=5 mice) of the treated mice on different days after CAR-T injection. The percentage of bone marrow infiltrating CAR-T cells identified by CD3+ GFP+ T cells on the 8th day after h transfer. Representative images (left panel) and summary results (n = 5 mice; right panel) are shown.
In order to clarify the potential mechanism of T9 CAR-T cells with significantly higher anti-tumor ability in vivo, we first evaluated the persistence of these cells in vivo by analyzing the presence and quantity of CAR- in the blood and spleen (the main tumor infiltrating organ). Sex. T cells change over time as the tumor grows.
Flow cytometry analysis showed that in the peripheral blood (days 4 to 24) (Figure 4e, f) and spleen (days 4 to 16) (Figure 4g), the absolute number of CD3+ (Figure 4f, g) (left Picture) or CD4+ (middle picture) and CD8+ (right picture) in mice treated with T9 CAR-T, CAR-T cells were significantly higher than those treated with T1 CAR-T cells. In addition to the spleen, NALM6 cells are also transferred to the bone marrow33.
Therefore, we checked the infiltration of CAR-T in the bone marrow and observed that on day 8 after metastasis, more T9 (compared to T1) CAR-T cells were found in the bone marrow of tumor-bearing mice (Figure 4h).
These results indicate that T9 CAR-T cells have better persistence and tumor infiltration ability, and thus have greater anti-tumor efficacy in vivo.
In order to determine which type of CAR-T cells are more effective in anti-tumor effects in vivo, we isolated human CD4+ and CD8+ T cells, polarized them under Th9 or Th1 culture conditions, and then injected them into tumor-bearing cells. In the mouse (Supplementary Figure 8a).
Our results show that compared with Th9, Th1 or Tc1 CAR-T cells, Tc9CAR-T cells exhibit the strongest anti-tumor efficacy, and Th9 CAR-T cells and Tc1 cells have similar anti-tumor capabilities, but in vivo It has a better anti-tumor effect than Th1 cells (Supplementary Figure 8b–d).
In addition, Th9 or Tc9 CAR-T cells showed stronger proliferation ability than Th1 and Tc1 CAR-T cells (Supplementary Figure 8e).
Human T9 CAR-T cells are converted into Th1-like effector cells in vivo.
Next, we analyzed the expression of T cell effector molecules in CAR-T cells on the 8th and 12th day after transfer.
Compared with the in vitro polarized cells expressing high levels of IL9 and low levels of IFN-γ, almost no IL9 expression in CD4+ Th9 CAR-T cells in the blood and spleen was detected on day 8, while IL12 was expressed in these two days CDH in CD8+ Tc9 CAR-T cells was not detected (Figure 5a).
It is worth noting that Th9 and Tc9 cells isolated from blood and spleen began to produce similar amounts of IFN-γ on day 8, and maintained higher IFN-γ production than Th1 and Tc1 CAR-T cells on day 12 (Figure 5a, b). In addition, after blood and spleen transfer, the frequency of GrzB-positive Th9 and Tc9 CAR-T cells also increased significantly (Figure 5c, d).
Although Th9 CAR-T cells polarized in vitro produce significantly lower IL2 than Th1 CAR-T cells, Th9 CAR-T cells gradually increase IL2 production after transfer and maintain the same level as Th1 CAR-T cells. (Figure 5e, f).
These results indicate that T9 CAR-T cells acquired effector T cell function after transfer.
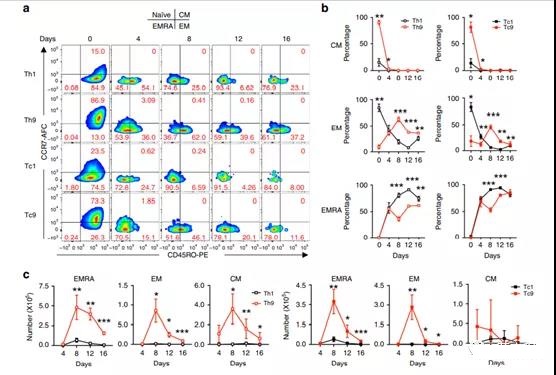
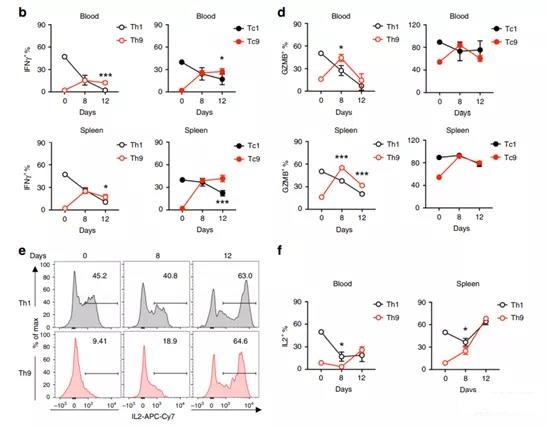
Figure 5 T9 CAR-T cells acquired effector functions in vivo after transfer.
- a Representative flow chart shows the percentage of IFN-γ and IL9-expressing CD4+ (Th1 or Th9) and CD8+ (Tc1 or Tc9) CAR-T cells from the spleens of treated mice on day 8 after transfer.
- b Summary data (n=5 mice) shows the CD4+ (Th1 or Th9; left image) and CD8+ (Tc1 or Tc9; right image) CAR-T cells expressing IFN-γ in peripheral blood (above) or spleen The 8th and 12th days after the frequency shift (below).
- c Representative flow chart shows the percentage of GrzB-expressing CD4+ (Th1 or Th9) and CD8+ (Tc1 or Tc9) CAR-T cells from the spleens of treated mice on day 8 and day 12 after transfer.
- d Summary data (n=5 mice) shows the frequency of GrzB-expressing CD4+ (Th1 or Th9; left image) and CD8+ (Tc1 or Tc9; right image) in peripheral blood (upper image) or spleen (lower image) Groups of mice treated on the 8th and 12th day after transfer.
- e Representative flow chart shows the percentage of IL2-expressing CD4+ CAR-T cells from the spleens of treated mice on day 8 and day 12 after transfer.
- f The aggregated data (n=5 mice) shows the frequency of IL2-expressing CD4+ CAR-T cells in the peripheral blood and spleen of the treated mice on the 8th and 12th day after transfer. Data are expressed as mean ± SD.
To determine the effect of IL9 or IFN-γ on the efficacy of T9 CAR-T cells, we treated NALM6-bearing mice with cytokine neutralizing antibodies and then injected T9 CAR-T cells (Supplementary Figure 9a).
Anti-IL9 or anti-IFN-γ antibodies do not significantly affect the anti-tumor efficacy mediated by T9 CAR-T in vivo (Supplementary Figure 9b-d).
We also evaluated the persistence of T9 CAR-T cells in the treated mice and revealed that the antibodies did not affect the number of CAR-T cells in the blood (Supplementary Figure 9e).
Human T9 CAR-T cells evolved into effectors, but there are still fewer depleted T cells in the body.
After determining that T9 CAR-T cells have evolved into Th1-like effector T cells, we explored whether they still exhibit a mature phenotype similar to T1 CAR-T cells.
We analyzed the CAR-T cell phenotype by examining the expression levels of CCR7 and CD45RO on the 4th to 16th day after transfer.
On day 8, the percentage of Tcm (CCR7+CD45RO+) subpopulations in Th9 and Tc9 CAR-T cells significantly decreased to a level similar to that of Th1 and Tc1 CAR-T cells (Figure 6a, b), and the percentage of Tem (CCR7 -The CD45RO+ in Th9 and Tc9CAR-T cells peaked on day 8 and dropped to low levels similar to Th1 and Tc1 CAR-T cells on day 16 (Figure 6a,b).
However, compared with T1 CAR-T cells, the absolute number of these cells in T9 CAR-T cells is significantly higher (Figure 6c).
After transfer in T1 and T9 CAR-T cells, the Temra (different end effector memory; CCR7-CD45RO-) subgroup also increased significantly, but its frequency was still lower in T9 CAR-T cells than T1 CAR-T Frequency in the cell (Figure 6a, b).
In T9 CAR-T cell-treated mice, the absolute number of Temra subpopulations peaked on day 8 and then began to decline (Figure 6c).
The mitochondrial staining performed by MitoTracker showed that the mitochondrial mass of T9 CAR-T cells was greater than that of T1 CAR-T cells (Supplementary Figure 10a, b).
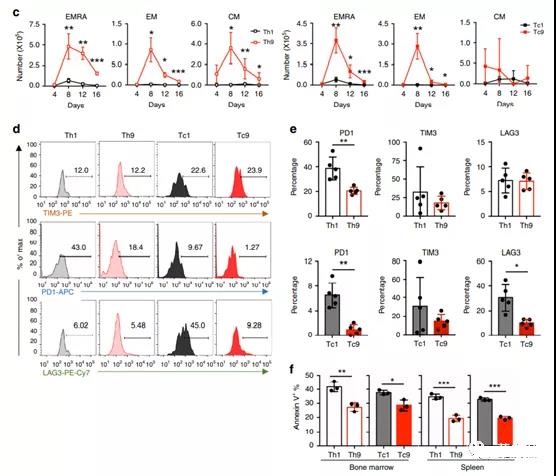
Figure 6. T9 CAR-T cells are long-lived T cells that consume less in the body.
- a Representative flow chart shows the frequency of CD4+ or CD8+CCD7+ and CD45R0+CAR-T cells from the spleens of treated mice at a specified number of days after the injection of CAR-T cells. Pre-gating GFP+CD3+CD8+ or GFP+CD3+CD4+ T cells.
- b Specify the number of days after injecting CAR-T cells, the frequency of T cell subsets in CAR-T cells of the treated mice and the total number of c (day 4, n=4 mice, other days, n=5 mice ).
- d Representative flow chart shows the expression of different depletion markers on CAR-T cells from the spleens of differently treated mice on day 4 after CAR-T cell injection.
- e On the 4th day after CAR-T cell infusion, CAR-T cells Th1 or Th9 (above figure) and Tc1 or Tc9 (below figure) and the frequency of PD1+, TIM3+ and LAG3+ in the spleen (n=5 mice) .
- f On the 4th day after transfer (n=3 mice), the frequency of annexin V+apoptotic CAR-T cells in the bone marrow and spleen of the treated mice.
Taking into account the differences in subsets, we speculate that T9 CAR-T cells will down-regulate the expression of co-inhibitory receptors (such as PD1, TIM3, and LAG3).
As expected, compared with Th1 or Tc1 CAR-T cells, Th9 and Tc9 CAR-T cells both expressed much lower PD1 levels, while Tc9 CAR-T cells expressed lower levels of LAG3 than Tc1 CAR-T cells ( Figure 6d, e).
Next, we checked the percentage of apoptotic CAR-T cells by annexin V staining, and showed that the T9 CAR-T cell population had significantly fewer annexin V+ cells than T1 CAR-T cells (Figure 6f).
Taken together, these data indicate that compared with T1 CAR-T cells in vivo, T9 CAR-T cells exhibit higher proliferation and less fatigue phenotypes, resulting in better anti-tumor capabilities.
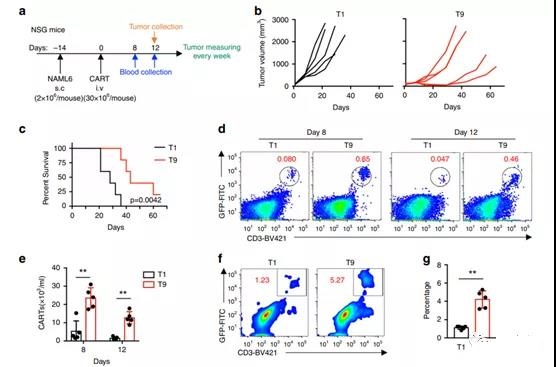
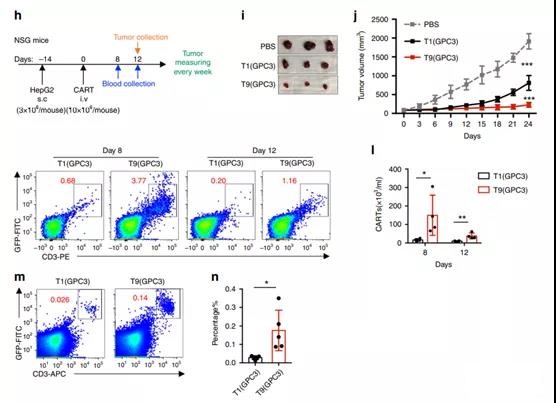
Figure 7 T9 CAR-T cells exert greater anti-tumor activity in solid tumor models.
- a NSG mice were inoculated subcutaneously with 2×10⁶ NALM6 cells. After 14 days, the mice were randomly divided into three groups, and 30×106 CAR-T cells were intravenously infused.
- b Tumor volume of mice treated with T1 or T9 CAR-T cells.
- c Kaplan-Meyer survival chart of CAR-T cell-treated mice (n=5 mice). The exact P value derived from the log-rank test is shown, compared to T9 and T9 CAR-T cell-treated mice.
- d Representative flow chart shows the frequency of treatment of CAR-T cells in peripheral blood of mice on a specified number of days after CAR-T infusion.
- e Percentage of CAR-T cells in the peripheral blood of treated mice measured on the 8th and 12th day after CAR-T cell injection (n=5 mice).
- f A representative flow chart showing the frequency of tumor-infiltrating CAR-T cells on day 12 after CAR-T cell injection.
- g On the 12th day after injecting CAR-T cells, the percentage of tumor-infiltrating CAR-T cells (n=5 mice).
- h NSG mice were inoculated subcutaneously with 3×10⁶ HepG2 cells. After 14 days, the mice were randomly divided into three groups, and 10×106 CAR-T cells were infused intravenously.
- i From representative tumor images of mice treated with designated T cells or PBS on day 24.
- j Growth curve of HepG2 xenograft mice treated with designated T cells or PBS (n=5 mice).
- k flow graph (left graph) and l summary data (right graph; n=4 mice) show the frequency of CAR-T cells in the peripheral blood of treated mice for a specified number of days after CAR-T infusion. m, n Percentage of tumor-infiltrating CAR-T cells on day 12 after CAR-T cell infusion (n=5 mice).
Human T9 CAR-T cells show enhanced ability to inhibit the growth of solid tumors.
Finally, we studied the efficacy of T9 CAR-T cells in the treatment of solid tumors.
We established a solid tumor model by subcutaneously injecting NALM6 cells into NSG mice. After 14 days, the tumor-bearing mice were treated with CAR-T cells (Figure 7a).
Compared with T1 CAR-T cells, T9CAR-T cells significantly inhibited the growth of tumors (Figure 7b) and improved the overall survival rate of mice (Figure 7c).
The improvement of T9 CAR-T cell treatment effect and peripheral blood The increase in CAR-T cell frequency is related, which is about 5 times higher than that of mice treated with T1 CAR-T cells (Figure 7d, e).
More importantly, compared with mice treated with T1 CAR-T cells, there were significantly more tumor-infiltrating GFP+ CD3+ CAR-T cells detected in T9 CAR-T-treated mice (Figure 7f, g) , Indicating that more T9 CAR-T cells infiltrated the tumor site.
To confirm the results, we constructed GPC3-41BB-Z CAR in a retroviral vector and generated CAR-T cells targeting GPC3.
The Th9 polarization state also significantly increased the expression of GPC3 CAR in T cells (Supplementary Figure 11a).
Flow cytometry showed that GPC3 Th9 and Tc9 CAR-T cells showed significantly enhanced IL9 (Supplementary Figure 11b) and reduced IFN-γ (Supplementary Figure 11c) expression.
Compared with GPC3 T1 CAR-T cells, GPC3 T9 CAR-T cells express high levels of CCR7, indicating a higher percentage of Tcm (CCR7+CD45RO+) cells (Supplementary Figure 11d).
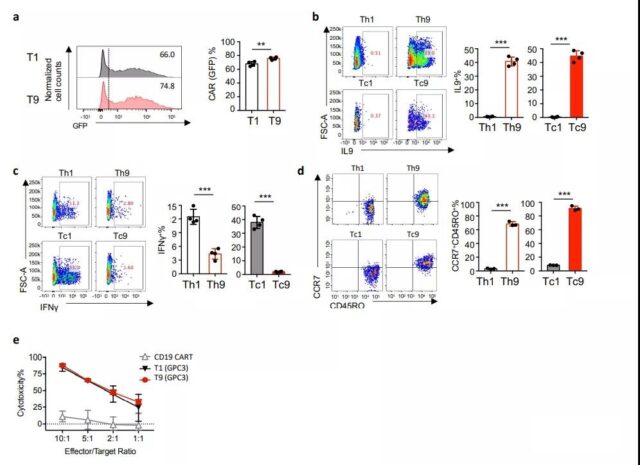
Supplementary Figure 11 Anti-tumor effect of GPC3 CAR-T cells. GPC3 CAR-T cells are generated and expanded for 14 days under Th1- or Th9 polarization conditions.
- (A) Calculate CAR (GFP) expression (percentage) in the CD3+ cell population (n=4 donors).
- (B) Representative flow chart (left panel) and summary data (right panel; n=4 donors), showing the expression of IL9 in GPC3 CAR-T cells. Pre-gating GFP+CD3+CD8+ or GFP+CD3+ CD4+ T cells.
- (C) Representative flow chart (left panel) and summary data (right panel; n=4 donors) showing IFNγ expression in CAR-T cells. Pre-gating GFP+CD3+CD8+ or GFP+CD3+CD4+ T cells.
- (D) Representative flow chart and pie chart (n=3 donors), showing the expression of CCR7 or CD45RO on CAR-T cells.
- (E) The indicated E:T ratio determined by flow cytometry in the 24-hour culture, the percentage of CAR-T cell specific lysis against the target tumor cell (HepG2).
- The experiment was carried out in three biological replicates, and the data shown (n=3) represents two independent experiments.
In order to determine the anti-tumor activity of T1 and T9 GPC3 CAR-T cells, we first performed an in vitro cytotoxicity test.
Both T1 and T9 GPC3 CAR-T cells effectively killed HepG2 cells expressing GPC3 (Supplementary Figure 11e).
Next, HepG2 cells were injected subcutaneously into NSG mice, and the tumor-bearing mice were treated with CAR-T cells 14 days after tumor inoculation (Figure 7h).
Both T1 and T9 GPC3 CAR-T cells inhibited the growth of HepG2, but T9 GPC3 CAR-T cells showed stronger anti-tumor activity than T1 GPC3 CAR-T cells (Figure 7I, j).
On the 8th and 12th day, we detected CAR-T cells in the peripheral blood of the treated mice. T9 was detected more frequently than T1 GPC3 CAR-T cells in both days (Figure 7k, 1).
Importantly, more T9 than T1 GPC3 CAR-T cells were also detected in the tumor (Figure 7m, n).
All in all, these data indicate that tumor-specific T9 CAR-T cells may be able to mediate effective anti-tumor immunity against solid tumors due to their strong proliferation ability and better tumor infiltration ability.
Nature : T9 CAR-T cells can enhance anti-tumor activity
(source:internet, reference only)
Disclaimer of medicaltrend.org
Important Note: The information provided is for informational purposes only and should not be considered as medical advice.