Exploration of potential microbial markers of lung cancer
- Why Lecanemab’s Adoption Faces an Uphill Battle in US?
- Yogurt and High LDL Cholesterol: Can You Still Enjoy It?
- WHO Releases Global Influenza Vaccine Market Study in 2024
- HIV Infections Linked to Unlicensed Spa’s Vampire Facial Treatments
- A Single US$2.15-Million Injection to Block 90% of Cancer Cell Formation
- WIV: Prevention of New Disease X and Investigation of the Origin of COVID-19
Exploration of potential microbial markers of lung cancer
Exploration of potential microbial markers of lung cancer. The biological disorders of the lung microbiota may be related to the development of lung diseases.
The biological disorders of the lung microbiota may be related to the development of lung diseases. However, the interaction between the lung microbiota and lung cancer remains unclear. Today we will share an article to see the possible significance of lung microbiota in lung tumors~
“Characterization of the lung microbiome and exploration of potential bacterial biomarkers for lung cancer”
Summary
The biological disorders of the lung microbiota may be related to the development of lung diseases. However, the interaction between the lung microbiota and lung cancer remains unclear. The purpose of this study is to evaluate and compare the differences in microbial classification and derived functions between lung cancer and benign lung diseases. Studies have been carried out on sample α diversity and β diversity, classification status of lung microbiota composition, and prediction of lung microbiota function. The results show that there are differences in the lung microbiota between patients with lung cancer and patients with benign lung diseases, and certain bacteria may have the potential to predict lung cancer. It is further speculated that the lung microbiome may have the potential as a new target for bacterial biomarkers and lung cancer treatment, which is worthy of further exploration.
Related concepts
1. Knowledge of microbial diversity research:
1). Diversity index: refers to the determination of species diversity.
There are three main spatial scales: α diversity, β diversity, and γ diversity.
The data measured by the environment of each spatial scale is different.
α Diversity: The main concern is the number of species in a local uniform habitat, so it is also called within-habitatdiversity.
The study of microbial diversity in community ecology can reflect the abundance and diversity of microbial communities through a single sample diversity analysis (α diversity), including a series of statistical analysis indexes to estimate the species abundance and diversity of environmental communities.
β diversity: refers to the difference in species composition between different habitat communities along the environmental gradient or the rate of species replacement along the environmental gradient. It is also called between-habitat diversity, the main ecological factor that controls β diversity There are soil, landforms and disturbances.
β diversity meaning:
① It can indicate the degree of isolation of the habitat by species;
②The measured value of β diversity can be used to compare the habitat diversity of different areas;
③ β diversity and α diversity together constitute the overall diversity or the biological heterogeneity of a certain area.
The study of microbial diversity in community ecology, β diversity is a comparative analysis of the microbial community composition of different samples/different groups of samples.
γ Diversity: Describes the diversity at the regional or continental scale. It refers to the number of species at the regional or continental scale. It is also called regional diversity. The ecological processes that control γ diversity are mainly hydrothermal dynamics, climate and the history of species formation and evolution.
In the study of microbial diversity in community ecology, γ diversity analysis refers to the combination of α diversity and β diversity.
2). Alpha diversity index
Calculate the index of community richness
Chao index. The larger the chao index, the more species in the sample.
Calculate the index of community diversity (Communitydiversity)
Shannon index, the larger the Shannon value, the higher the community diversity.
2.principal coordinate analysis (PCoA):
Principal coordinate analysis is a visualization method to study the similarity or difference of data. After sorting through a series of eigenvalues and eigenvectors, select the eigenvalues that are mainly in the top. PCoA can find the most important in the distance matrix The result is a rotation of the data matrix. It does not change the mutual positional relationship between the sample points, but only changes the coordinate system. PCoA can observe the differences between individuals or groups.
The difference in flora between two samples or two groups of samples can be seen intuitively by analyzing the distance between the sample and the sample in the coordinate axis. If the linear distance between two samples or two groups of samples is close, it means that the difference of the flora of these two samples or two groups of samples is small; on the contrary, if the linear distance between two samples or two groups of samples is relatively short Far, it means that the flora between them is quite different.
3. KEGG pathway enrichment analysis
The KEGG PATHWAY database is a collection of hand-drawn metabolic pathways. Gene pathway enrichment analysis is to find a type of overexpressed gene or protein in a set of genes or proteins. Through gene pathway enrichment analysis, the biological processes or signal pathways that genes may participate in can be preliminary analyzed.
4. GINI (Gini Coefficient)
The Gini coefficient is an internationally used indicator to measure the income gap of residents in a country or region. Therefore, use in the model is an index to evaluate the distinguishing ability of the model.
- Gini<0.3, the model is not acceptable;
- 0.3<=Gini<0.35, the model distinguishing ability is general, the model has room for optimization;
- 0.35<=Gini<=0.5, the model distinguishing ability is relatively satisfactory;
- Gini>0.5, the higher the Gini, the more the possibility of over-simulation.
5. Random Forest Model
Random forest is a commonly used method in machine learning. Random forest, as its name implies, is to build a forest in a random way. There are many decision trees in the forest, and there is no correlation between each decision tree in the random forest. After getting the forest, when a new input sample enters, let each decision tree in the forest make a judgment separately to see which category the sample belongs to (for the classification algorithm), and then see which If one category is selected the most, then predict that sample belongs to that category.
Background
In the past, people usually thought of the lung as a sterile environment. However, high-throughput sequencing technology found that there are many bacterial communities in the lungs, including Proteobacteria, Firmicutes and Bacteroides. There is increasing evidence that there is a link between changes in the lung microbiota and lung diseases such as asthma, chronic obstructive pulmonary disease, idiopathic pulmonary fibrosis (IPF), cystic fibrosis and lung cancer.
Some specific microorganisms are known to be related to cancer. For example, Helicobacter pylori is associated with a high risk of gastric cancer; the number of Fusobacterium nuclei is associated with the prognosis of patients with colorectal cancer. The link between the microbiome and lung cancer remains relatively unclear. Although some previous studies have noted that changes in specific microbiota in bronchoalveolar lavage fluid, lung tissue, sputum, saliva, and stool samples may be related to lung cancer, these studies have produced conflicting results. In addition, studies have found that Lactobacillus shows an effect in the treatment of lung cancer in mice, which means that regulating microorganisms may affect the treatment of lung cancer. Therefore, the article further explores the relationship between the microbiota and lung cancer, and explores the underlying mechanism of its interaction.
A previous study showed that the individual microbiota can remain stable for a long time, which highlights the potential of the microbiota as a diagnostic method and therapeutic target. Because saliva and sputum samples are easily disturbed by the oral microbiota, and it is often difficult to obtain lung tissue samples from patients with advanced lung cancer, some experts believe that BALF is a viable method for sampling the lung microbiota because the BALF microbiota Will not be disturbed by oral contamination. In order to validate previous studies and provide a more specific understanding of how lung microbiota affects lung cancer patients and individuals with benign lung diseases, this study aims to further apply 16S rRNA-based next-generation sequencing to study the lung microbiota in BALF samples Differences in classification and derived functional characteristics.
Methods
1. The study recruited 54 patients, of which 32 patients were pathologically diagnosed with lung cancer, and 22 patients were diagnosed with benign lung disease as the control group. The demographic and clinical data of all participants were recorded, including age, gender, body mass index (BMI), smoking history, smoking index, tumor markers, pathological type, and tumor stage.
2. Extract genomic DNA from BALF samples using cetyltrimethylammonium bromide/sodium lauryl sulfate method.
3. Further analysis by 16S rRNA amplicon sequencing.
4. The calculation method of α diversity is to use ASVs, Chao1, Shannon index to measure. Beta diversity is measured on sparse data using Bray-Curtis metric, unweighted uniformity, and weighted uniformity. Nonparametric multivariate analysis of variance was used to assess the diversity differences between groups. Based on Bray-Curtis metric, unweighted uniform distribution and weighted uniform distribution, the principal coordinate analysis is performed. The KO abundance was predicted based on the ASVs data, and the KEGG pathway of differential enrichment was estimated based on the LDA score of LEfSe. The random forest model is used to estimate the importance of each different genera, and the ability to predict lung cancer is evaluated according to the AUC value in the ROC characteristic curve.
5. Wilcoxon rank sum test is used to perform hypothesis testing on the categorical abundance data between groups (appearance rate> 10%, average abundance> 0.5%) to obtain P values based on different levels of categorical abundance tables, and pass them as needed Benjamini Hochberg’s correction adjusts the P value for multiple tests. The relationship between microbial data and clinical parameters was evaluated using Spearman’s correlation test.
Results
Baseline characteristics of clinical samples
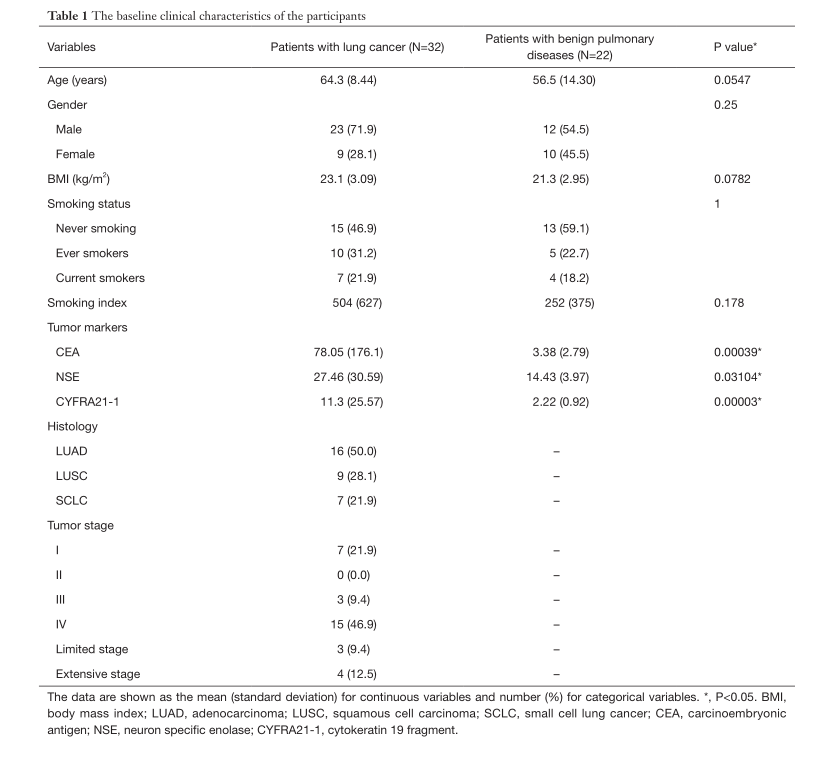
Table 1 shows the demographic and clinical data of 54 participants, including 32 patients with lung cancer and 22 patients with benign lung disease.
It can be found from the table that the two groups have no significant differences in age, gender, BMI, smoking status and smoking index. There are significant differences in lung tumor markers (CEA, NSE, CYFRA21-1). Differences in patient clinical characteristics (including age, gender, body mass index, and smoking) may affect a single bacterial community. There is no statistically significant difference between the two groups of patients in these factors, so sequencing the final microbiota is avoided to the greatest extent Interference.
Alpha and beta diversity between lung cancer and control group
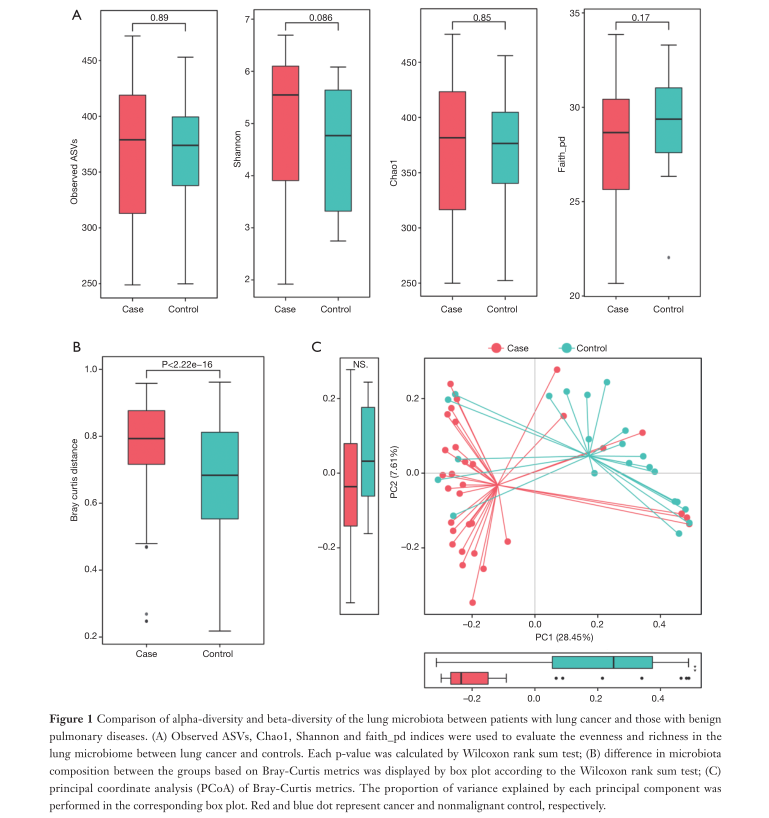
Fig1. Explores the difference between the alpha diversity and beta diversity of lung microbiota in patients with lung cancer and patients with benign lung diseases.
A. Assess the uniformity and richness (α diversity) of the lung microbiome between the lung cancer group and the control group by ASV, Chao1, Shannon, and faith_pd index. It can be found from the figure that the four P values are all greater than 0.05, so the richness and average degree of the lung microbiome of lung cancer patients and benign lung patients are similar.
B. According to Wilcoxon rank sum test, Bray-Curtis is used to measure the difference in microbial community composition between groups (β diversity). It was found that: P<0.05, so there was a significant difference in β diversity between the two groups.
C. According to the Bray-Curtis metric, the principal coordinate analysis is carried out. The long straight line distance between the two groups of samples indicates that there is a greater difference in flora between patients with lung cancer and patients with benign lung diseases.
Classification status of lung microbiota composition
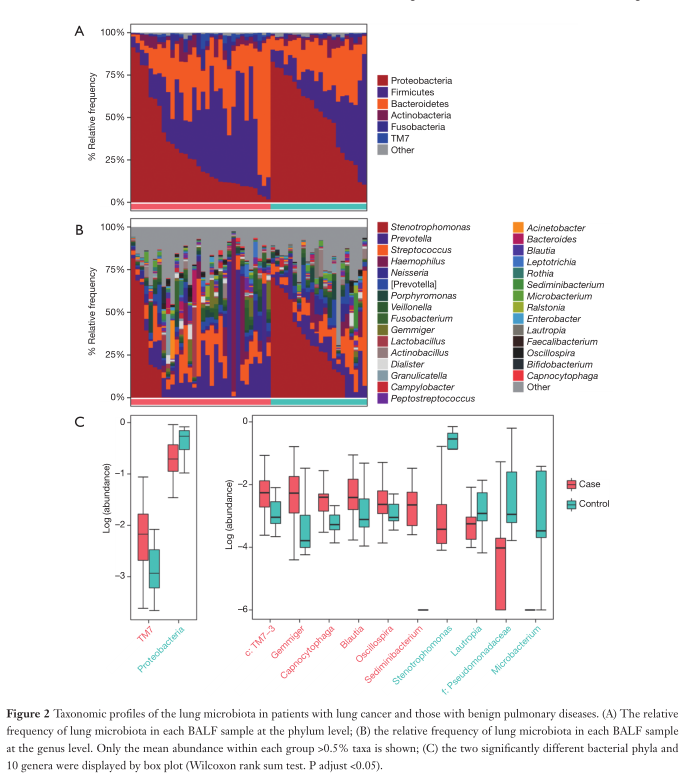
Fig2. Explored the differences in the classification of lung microbiota between patients with lung cancer and patients with benign lung diseases. According to the relative abundance of the microbial communities in the two groups of BALF samples, classification and analysis were carried out at the phylum and genus level.
A. Shows the relative abundance of the lung microbiota at the phylum level in each BALF sample. It can be found that: Proteobacteria, Firmicutes and Bacteroides are the most common in the cancer group and the control group. Moreover, the average abundance of Actinomycetes, Fusobacterium and TM7 in the two groups were all greater than 0.5%.
B. Shows the relative abundance of the microbial communities in each BALF sample at the genus level. It can be found that phagomonas, Prevotella, Streptococcus, Haemophilus and Neisseria are the most common in the cancer group and the control group.
C. Two distinct bacterial phyla and 10 genera are shown with box plots.
Compared with benign lung diseases, the relative abundance of TM7 in patients with lung cancer increased significantly (adjusted P=0.005634), and protein bacteria decreased significantly (adjusted P=0.01388).
There are 6 genera (c: TM7-3, Cystocytosis, Sedimentobacter, Gram-negative bacteria, Boulardella, and Oscilloscope) in patients with lung cancer. Abundant (adjusted P<0.05), there are four genera (Microbacteria, Stynotrophomonas, Lautosia and Pseudomonas) with lower abundance than benign patients.
Predict the function of the lung microbiota
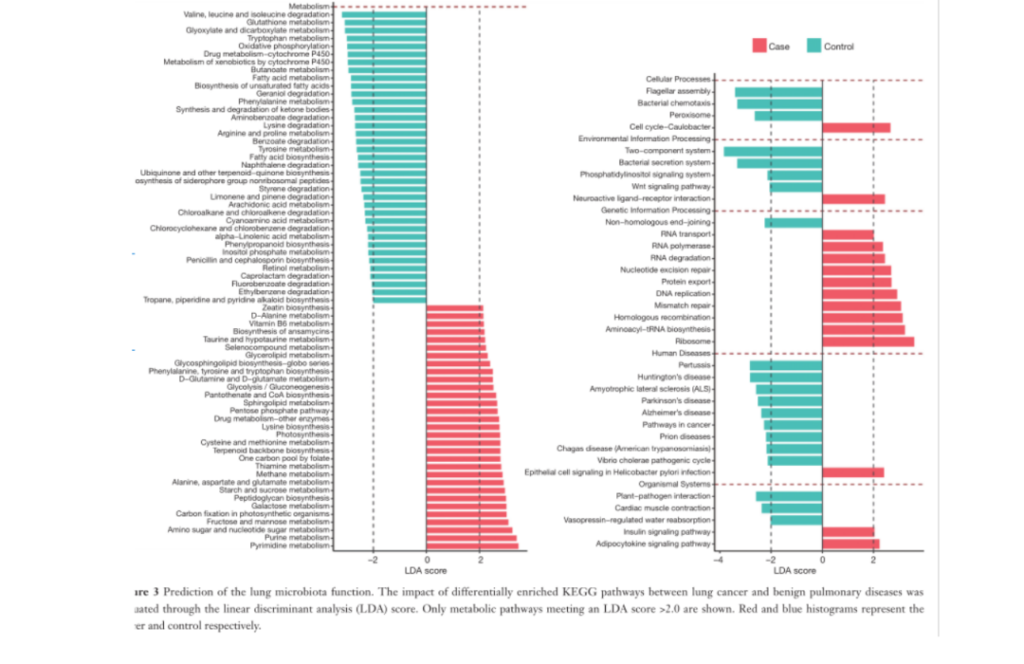
Fig3. The function of lung microbiota is predicted. The linear discriminant analysis (LDA) score was used to evaluate the impact of the differentially enriched KEGG pathway between lung cancer and benign lung diseases. Only the metabolic pathways that meet the LDA score> 2.0 are shown.
It can be found from the figure that there are 46 and 57 different ways in the lung cancer group and the control group, respectively. The microbiota in the BALF samples of lung cancer patients has obvious metabolic behaviors of ribosomal metabolism, pyrimidine metabolism and purine metabolism. In samples from patients with benign lung diseases, the two-component system, flagellar assembly, and bacterial secretion system were significantly excessive.
Potential bacterial biomarkers for lung cancer patients
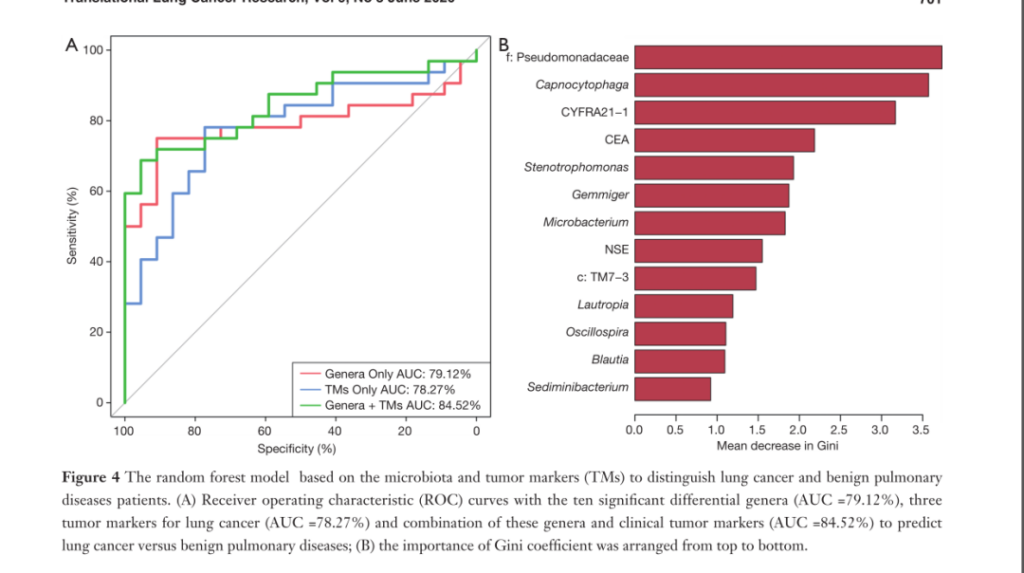
Fig4. Random forest model based on microbiota and tumor markers (TMs) to distinguish patients with lung cancer and benign lung diseases.
Picture A: Three groups were compared: Genera group: ten significantly different genera (AUC =79.12%), TMs group: three lung cancer tumor markers (AUC = 78.27%), Genera+TMs group: ten significant differences The efficacy of the combination of genera and clinical tumor markers (AUC = 84.52%) in detecting benign and malignant lung diseases can be found by ROC curve: Genera+TMs group: ten significantly different genera and clinical tumor markers combination AUC = 84.52% is the highest, indicating the best detection effect.
Panel B: shows the Gini coefficient of each marker. It can be seen from the figure that compared with clinical tumor markers, the Gini coefficients of Pseudomonas and Cystocytosis are higher, and the distinguishing ability is relatively satisfactory.
Next, the author also analyzed the correlation between microbial markers (cystophilic bacteria, sedimentary bacteria and c:TM7-3) and tumor markers (CEA and CYFRA21-1). The analysis found that the two were positively correlated and Significant correlation.
Discuss
in conclusion:
1. There is a big difference in flora between patients with lung cancer and patients with benign lung diseases, and a differentiation trend is observed in the overall structure of the microbial community.
2. There is no significant difference in the abundance and diversity of microbial communities in samples from lung cancer patients and non-malignant lung disease patients.
3. In the samples of lung cancer patients, the relative abundance of TM7 and c:TM7-3 was significantly increased.
4. The metabolic pathways of ribosome and pyrimidine in lung cancer patients are significantly rich.
5. The combination of bacteria and clinical tumor markers can better predict lung cancer.
Limitations:
1. The number of patients registered in this study is not large enough, and lung cancer patients are not classified according to histological subtypes or different stages, and there may be heterogeneity.
2. In the absence of a validation cohort, using specific bacteria to distinguish between lung cancer and benign lung disease may lead to false positive values and unreliability.
3. This study is a cross-sectional study, and the mechanism of interaction between the microbiomes has not been further explored.
~~~~ Exploration of potential microbial markers of lung cancer ~~~~
~~~~ Exploration of potential microbial markers of lung cancer ~~~~
~~~~ Exploration of potential microbial markers of lung cancer ~~~~
(sourcechinanet, reference only)
Disclaimer of medicaltrend.org