Cell subsets and biomarkers of prostate cancer progression
- Normal Liver Cells Found to Promote Cancer Metastasis to the Liver
- Nearly 80% Complete Remission: Breakthrough in ADC Anti-Tumor Treatment
- Vaccination Against Common Diseases May Prevent Dementia!
- New Alzheimer’s Disease (AD) Diagnosis and Staging Criteria
- Breakthrough in Alzheimer’s Disease: New Nasal Spray Halts Cognitive Decline by Targeting Toxic Protein
- Can the Tap Water at the Paris Olympics be Drunk Directly?
Cell subsets and biomarkers of prostate cancer progression
Cell subsets and biomarkers of prostate cancer progression. The study used single-cell sequencing to analyze the transcriptome of prostate cancer, revealing the changes of cell subgroups in the microenvironment at each stage of the development of prostate cancer, and identifying the endothelial cells that are aggressive.
Prostate cancer ranks second in the incidence of men. Understanding the heterogeneity of prostate cancer patients and the tumor microenvironment at the single-cell level can understand the occurrence and progression of the disease, and also help to screen new markers and guide treatment.
Background introduction
Today, the editor will share with you a single cell study, Single cell analysis reveals onset of multiple progression associated transcriptomic remodellings in prostate cancer, which is a collaboration between Shanghai Changhai Hospital, the University of Toronto in Canada and the Cancer Hospital of Fudan University in China, published in Nature in 2021. Cell Biology (IF=20.042) magazine.
In this work, the author analyzed 27 tissue samples and obtained 111,914 single cells, providing a single-cell gene expression profile of prostate cancer. The research results are of great value for new treatment strategies and marker screening for prostate cancer. .
Data introduction
Cohort 1:
12 prostate cancer patients, a total of 13 tissue samples. Contains 12 primary prostate cancer and 1 prostate cancer lymph node metastasis. Sequencing platform: 10x Genomics.
Cohort 2:
1 patient’s primary prostate cancer lesion and 2 (without lymphatic metastasis) external iliac lymph nodes.
Sequencing platform: BD Rhapsody.
Cohort 3:
Five castration-resistant prostate cancer lesions (CRPC), and six prostate tissues served as controls. Sequencing platform: BD Rhapsody.
Result analysis:
01 Single-cell transcriptome map of prostate cancer
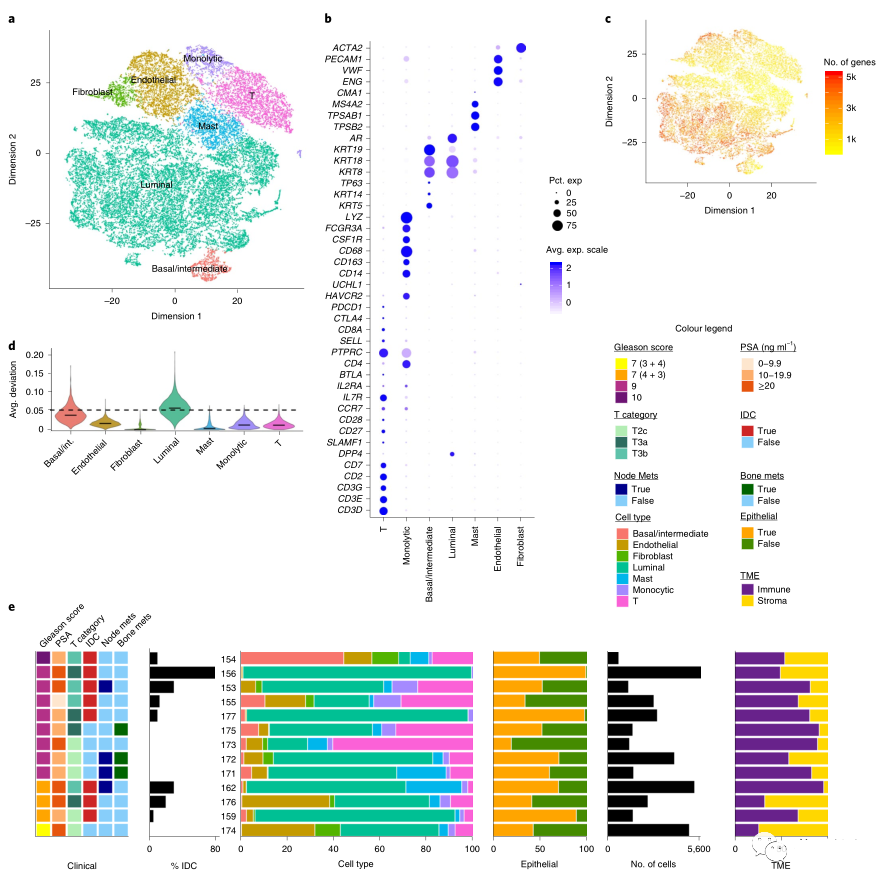
The author performed single-cell transcriptome sequencing on 13 samples (12 primary prostate cancer and 1 prostate cancer lymph node metastasis) in Cohort 1, and obtained 36,424 cells, including: basal/interstitial epithelial cells, Luminal cells, and adult cells. Fibroblasts, endothelial cells, mast cells, T cells, monocytes (Figure 1A, B).
In Luminal cells, in addition to expressing classic keratin genes, the expression of T cell costimulatory genes was also observed (Figure 1B), indicating that Luminal epithelial cells are involved in antigen presentation.
Epithelial cells express more genes, while the complexity of the tumor microenvironment (ie, non-epithelial cells) is lower (Figure 1C).
The CNV deviation in Luminal cells was significantly higher than that in other cells, indicating that non-malignant epithelial cells may also have CNV changes (Figure 1D).
Different patients have different cell types (Figure 1E), among which Luminal cells are the main epithelial type in most patients.
02 Analysis of Prostate Cancer Epithelial Cell Subpopulations
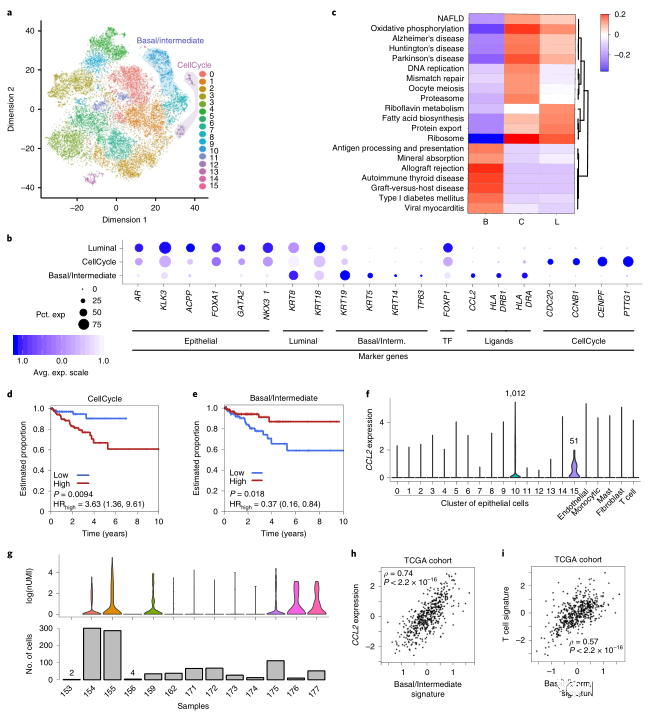
The epithelial cells were further subdivided into subpopulations, resulting in 16 cell subpopulations (Figure 2A).
Through the signature of prostate cancer PAM50, it was found that cluster10 and cluster12 of epithelial cells may be related to the progression of prostate cancer. Among them, cluster10 highly expressed many basal cell/intermediate cell marker genes (KRT5, KRT14, KRT19, TP63), and cluster12 highly expressed cell cycle-related genes (CDC20, CNB1, CENPF, PTTG1).
Functional enrichment analysis found that the cluster12 cell cycle-related cell population was enriched in functions such as oxidative phosphorylation and DNA replication, while basal/intermediate cells were related to antigen presentation (Figure 2C).
The cell population of the cell cycle expresses more luminal B-type, hypoxia, and PCS1 characteristics. These characteristics can predict patient survival (Figure 2D), but it does not indicate that the state of the cell cycle is the driving factor.
Basal/intermediate cells express more luminal type A and show a better prognosis. In basal/intermediate cells, many HLA class II genes and chemokine CCL2 are also expressed, and the expression of CCL2 in basal/intermediate cells is positively correlated with the expression of this gene in TCGA bulk RNA (Figure 2H).
CCL2 is a chemokine that can recruit immune cells such as macrophages and T cells. The author further analyzed the relationship between the content of basal/intermediate cells and the infiltration of macrophages and T cells. A strong observation was also made in the TCGA bulk RNA data. The correlation (Figure 2I).
Summary: Basal/intermediate cells can attract immune cells, so it is speculated that patients with high expression of basal/intermediate cells have a good prognosis.
03 Tumor-associated macrophages show osteoclast-like characteristics
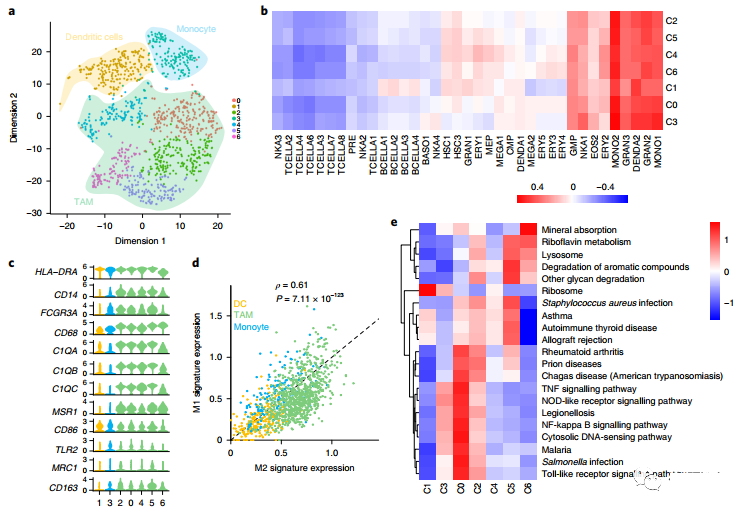
The authors observed two different types of myeloid cells: monocytes and mast cells (Figure 3A).
The monocytes were further subdivided into subgroups, and it was found that Cluster1 showed the characteristics of myeloid-derived dendritic cells, while other clusters showed the characteristics of monocytes (CD14, FCGR3A) (Figure BC), Cluster0, 2, 4, 5, 6 showed the characteristics of macrophages (CD204).
When paying attention to tumor-related macrophages, it was observed that there are two subtypes of M1 and M2, and the two subtypes have a strong positive correlation (Figure 3D). However, the biological pathways involved in different macrophage subclusters are different. Cluster 6 shows the activation of osteoclast (OC) related pathways, such as mineral absorption and lysosomes (Figure 3E).
04 Infiltrated CD8+ effector T cells express tumor marker genes
T cells can be further subdivided into CD4+ T cells, CD4+ T regulatory cells (Treg), CD8+ T naive cells and CD8+ T effector cells (Figure 3F, G).
Among them, Cluster 2, 3, and 5 are all CD8+ effector T cells, but they show strong heterogeneity. Cluster 5 has lower immune and metabolic activity, while Cluster 3 has stronger T cell activity.
PSA (Prostate Cancer Specific Antigen) is a commonly used clinical molecular diagnostic marker for prostate cancer, which is secreted by tumor cells. KLK3 is a gene encoding PSA. The expression of KLK3 gene was found in Custer3, Cluster5 and Treg cells. Along with the increase in the abundance of KLK3 expression, the extracellular vesicle (EV) activity of T cells also gradually increased (Figure 3H).

05 EVs derived from prostate cancer cells induce T cells to express KLK3
In order to verify whether T cells expressing the epithelial tumor marker KLK3 only appears in T cells of prostate cancer, the authors analyzed the single-cell transcriptome data of four other cancer types: head and neck squamous cell carcinoma (HNSCC), non-small cell Lung cancer (NSCLC), colorectal cancer (CRC) and hepatocellular carcinoma (HCC). The expression of the tumor marker gene KLK3 in T cells was found in the four cancer types (Figure 4A), indicating that the high expression of KLK3 may be a common feature of infiltrating T cells.
The author verified the expression of tumor marker gene KLK3 in T cells through flow cytometry and RT-PCR technology (Figure 4B).
In order to explore whether the vesicle EV secreted by the tumor affects nearby lymph nodes and the extent of its impact, the authors performed single-cell transcriptome sequencing on a patient of Cohort 2. This patient has 1 primary prostate cancer lesion and 2 external iliac lymph nodes, and MRI and histopathological analysis were judged to have no lymph node metastasis. However, single-cell CNV analysis showed that the epithelial cells of the left lymph node were consistent with the CNV of the tumor cells, while the right lymph node did not. It is speculated that the patient had slight left lymph node metastasis (Figure 4D, E, F), and the left lymph node There is a large amount of KLK3 expression in T cells.
CNA analysis showed that a part of the epithelial cells (84/153) contained CNAs that were consistent with the average tumor CNA profile, indicating that the left LN had lymphatic micrometastasis (Figure 4H). The authors observed that KLK3 is widely expressed in all types of cells, most of which are T cells, which are expressed in lymph samples on the left but not in lymph samples on the right (Figure 4I). It indicates that the genetic changes of immune cells in the lymph nodes may occur before the actual metastasis.

06 Cancer-related fibroblast and endothelial cell heterogeneity
Cancer-associated fibroblasts (CAF) play an important role in the progression of prostate cancer. The authors identified 948 fibroblasts (Figure 5A), which can be subdivided into three subtypes (Figure 5A, B), of which VIM is at 3 High expression in all subgroups.
The authors performed gene enrichment analysis on the first 150 up-regulated genes of each CAF subtype. All three subtypes were enriched for angiogenesis-related functions, and those related to myofibroblasts, cell adhesion, and extracellular matrix (ECM) Function (Figure 5C) is subtype specific.
The 3,115 endothelial ECs can be further divided into 6 subgroups (Figure 5D). PECAM1 is evenly expressed in all endothelial cells, FLT1 is less expressed and PDPN is not expressed, indicating that endothelial cells are derived from blood vessels rather than lymphatics (Figure 5D). 5E).
Cluster2 expresses S100A4, a gene that promotes tumor angiogenesis and is associated with metastasis. Cluster3 and 4 express THY1, which is reported to be expressed in melanoma microvascular endothelial cells and is associated with metastasis. Cluster5 also has the expression of THY1, ACTA2 and S100A4.
Evolutionary analysis revealed two different fates of endothelial cells. Starting from clusters 0 and 1, one part advances to clusters 3 and 4, and the other part advances to cluster 5. Cluster 2 is a transition state (Figure 5F). Endothelial cells expressing characteristic genes become active endothelial cells (aECs).
The most abundant pathways in cluster 0 and cluster 1 are mostly related to immunity, while the most common pathways in active endothelial cells (aECs) are ECM receptor signaling and focal adhesion pathways (Figure 5K).
Summary: Active endothelial cells (aECs) can change ECM and reduce immune activity.

07 Vascular endothelial cells are enriched in castration-resistant prostate cancer and promote cancer cell invasion
The author performed scRNA-seq analysis on 3 cases of prostate tissue and 5 cases of castration-resistant prostate cancer tissue (CRPC) in Cohort 3 (Figure 6A, B). Through evolutionary analysis, it is found that as the tumor progresses to castration-resistant prostate cancer, the proportion of active endothelial cells (aECs) gradually increases, and these endothelial cells are mainly derived from castration-resistant prostate cancer, indicating a subset of active endothelial cells aECs are closely related to the development of prostate cancer into castration-resistant prostate cancer.
In order to verify the relationship between aECs and castration-resistant prostate cancer, the author collected primary prostate cancer, castration-resistant prostate cancer, and normal prostate tissue, and separated aECs by flow sorting technology, and found the main source of these aECs For castration-resistant prostate cancer tissue.
The co-culture technique once again verified that aECs can increase the invasion ability of prostate cancer cells (Figure 6H).

Sum up:
The study used single-cell sequencing to analyze the transcriptome of prostate cancer, revealing the changes of cell subgroups in the microenvironment at each stage of the development of prostate cancer, and identifying the endothelial cells that are aggressive.
The molecular typing markers at the single cell level of prostate cancer and cell subtypes related to tumor progression were discovered. This research has great value for the development of new treatment strategies for prostate cancer and tumor biomarkers.
(source:internet, reference only)
Disclaimer of medicaltrend.org