AI technology predicts the quality of T cells in the manufacturing process
- WHO Releases Global Influenza Vaccine Market Study in 2024
- HIV Infections Linked to Unlicensed Spa’s Vampire Facial Treatments
- A Single US$2.15-Million Injection to Block 90% of Cancer Cell Formation
- WIV: Prevention of New Disease X and Investigation of the Origin of COVID-19
- Why Botulinum Toxin Reigns as One of the Deadliest Poisons?
- FDA Approves Pfizer’s One-Time Gene Therapy for Hemophilia B: $3.5 Million per Dose
AI-based technology platform predicts the quality of T cells in the manufacturing process
AI technology predicts the quality of T cells in the manufacturing process. As current chemistry, manufacturing and control (CMC), analysis, regulations, and product specifications are designed for conventional chemical and biopharmaceutical manufacturing systems, the challenge of manufacturing “living products” is further amplified.
This emphasizes the need to develop innovative tools, methods and standards to ensure proper quality control, as well as new strategies involving quality of design (QbD) and good manufacturing practices (GMP) for cell-based therapies [7–9]. The complex manufacturing process of T cells and other cell therapies must be thoroughly evaluated and appropriately controlled to ensure scalability, predictability and high-quality manufacturing processes at the most reasonable cost. The key step to achieve this goal is to identify putative CQA and CPP as early as possible in the manufacturing process. These CQA and CPP can predict the quality of manufactured cell therapy products.
Generally, T cells in a poorly differentiated state (such as naive and stem cells or central memory cells) have been shown to provide excellent anti-tumor potential, which may be due to their higher replication, migration and transplantation potential, resulting in long-term, long-lasting Response [18-21]. Similarly, CD4 T cells are equally important in anti-tumor efficacy due to their cytokine release properties and anti-fatigue ability [22,23].
Scientists hypothesize that strict characterization of process parameters and longitudinal measurement of cytokines, chemokines and metabolites secreted by cells from the culture medium in the early stages of the manufacturing process will enable us to develop an AI-based mathematical calculation framework to identify Multivariate parameters.
Scientists have developed a novel degradable microscaffold (DMS)-based method that uses porous microcarriers with anti-CD3 and anti-CD28 mAb functions for T cell expansion and culture. Scientists found that compared with commercially available microbeads (Miltenyi), degradable microscaffolds (DMS) produced a greater number of migrating naive (TN) and central memory (TCM) across multiple donors (CCR7+CD62L+) T cells and CD4+ T cells [12].
Taking the manufacturing process as an example, Scientists developed an AI-based experimental calculation tool that can predict product quality from early process measurements.
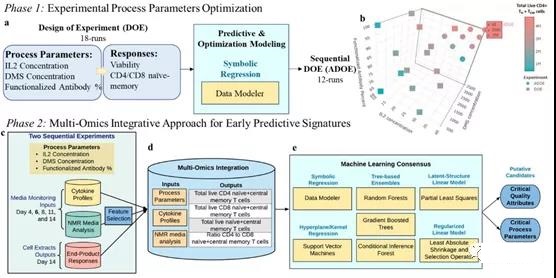
This two-stage method includes:
- (1) optimizing process parameters through experimental design
- (2) using regression models to extract early predictive features of T cell quality through multi-omics integration.
This agnostic calculation method provides a platform for the discovery of early prediction of CQA and CPP to ensure consistent product quality and can be widely used in other cell therapies.
I. Overall multi-omics research design
T cells were expanded in vitro for 14 days, and 100 μL of supernatant medium samples were collected on days 4, 6, 8, 11, and 14 to measure cytokine profiles and perform NMR analysis. For different combinations of DMS parameters (based on IL2 concentration, DMS concentration and percentage of functionalized antibody), IL2 concentration (10, 20 and 30 U/μL), DMS concentration (500, 1500, 2500 carrier/μL) and percentage of functionalized antibody (60%, 80%, 100%), the endpoint response of T cell extract based on DMS was measured. Two experimental areas were determined using the design of experiment (DOE) method to maximize the production of CD62L+ CCR7+ cells (i.e. naive and central memory T cells, TN+TCM) based on these process parameters.
The first DOE made a random 18-run optimal custom design, in which each DMS parameter was evaluated at three levels. In order to further optimize the DOE based on the total viable CD4+ TN+ TCM cells, a sequential adaptive experimental design (ADOE) with 12 other samples was designed (Figure 1b). The process parameters of ADOE were evaluated at multiple levels: IL2 concentration (30, 35 and 40 U/μL), DMS concentration (500, 1000, 1500, 2000, 2500, 3000, 3500 vector/μL) and percentage of functionalized antibody (100%).
Molecular characterization was performed on all 30 runs of the two experiments (DOE, ADOE) to simulate the total real-time TN+ TCM (a) CD4+, (b) CD8+ and (c) their ratios.
In the in vitro culture process, the early prediction of CPP and CQA for the expansion of TN+ TCM cells is divided into two stages: (1) optimization of process parameters, and (2) integration of multi-omics for predictive modeling (Figure 1).
II. Optimize TN+ TCM cells according to process parameters
Using symbolic regression (DataModeler software), Scientists examined the interaction of DMS parameters on yield to simultaneously predict and optimize CD4+ and CD8+TN+TCM. The model set predicts 4.2×10⁶ CD4+TN+TCM cells under the optimal settings of 30 U/μLIL2, 2500 vector/μL and 100% functionalized mAb (see Figure S1, S3, S4). This result is consistent with the observed maximum value of 4.0×10⁶, highlighting that under the high level of DMS parameters, the yield of CD4+TN+TCM is the highest (Figure 1b). In contrast, under the setting of 30 U/μL IL2, 600 vector/μL and 100% functionalized mAb, the predicted optimal yield of CD8+TN+TCM is 1.9×10⁷ cells (see Figure S2, S3, S4). Although this combination was not tested experimentally, the closest measurement record (30 U/μLIL2, 500 vector/μL, 100% functionalized mAb) reached the expected maximum yield. Therefore, the yield of CD8+ TN+ TCM is greatest at high IL2 concentration and percentage of functionalized mAb but low DMS concentration.
The DOE analysis emphasizes the potential to further optimize the total viable CD4+ TN+ TCM cells and the potential to optimize the ratio of CD4+ to CD8+ TN+ TCM cells when the DMS content is higher than the initially assessed level (DOE). Therefore, for testing and verification, a second adaptive experimental design (ADOE) was designed to maximize the total viable CD4+ TN+ TCM cells.
Scientists expanded the parameter range and evaluated IL2 concentration> 30 U/μL and DMS concentration> 2500 vector/μL (Figure 1b). When IL2 concentration (40 U/μL) and DMS concentration (3500 vector/μL) are maximized, the ratio of CD4+TN+ TCM and CD8+ TN+ TCM is 4.7×10⁶ cells and 0.49, respectively (Figure 1b; attached table). S2; Appendix Figure S1-S11). Using the DOE data set, a new response set is generated, so that more reliable predictions can be made on the expanded parameter space (↑IL2 and ↑DMS concentration).
III. Multi-omics comprehensive analysis for early monitoring of T cell manufacturing
Due to the heterogeneity of the collected multivariate data, and knowing that no single model structure is suitable for all applications, Scientists implemented an agnostic modeling method to better understand these TN+ TCM responses.
When using multiple omics predictors for all endpoint responses, the SR model achieved the highest prediction performance (R2>93%) (Table 1). SR reached R2>98%, while the integration based on the GBM tree showed a leave-one-out cross-validated R2 (LOO-R2)>95% for CD4+ and CD4+/CD8+TN+ TCM responses. Similarly, the LASSO, PLSR and SVM methods showed consistent high LOO-R2, 92.9%, 99.7%, and 90.5%, respectively, to predict CD4+/CD8+ TN+ TCM. However, the LOO-R2 of CD4+TN+TCM observed using these three methods is reduced by about 10%, that is, 72.5%-81.7%. Finally, for CD8+ TN+ TCM cells, R2 of SR and PLSR> 90%, while LOO-R2 (0.3%, RF-51.5%, LASSO) of other ML methods showed great differences.
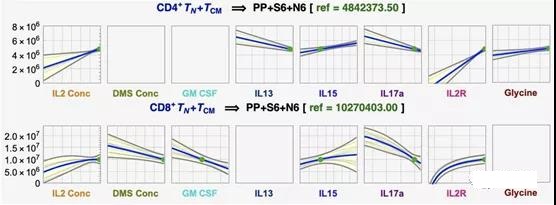
The best performing technique SR showed that when IL2 concentration, IL15 and IL2R increase and IL17a decreases with other characteristics, the median aggregate prediction for CD4+ and CD8+ TN+ TCM cells will increase. These modes, combined with the DMS concentration and the low value of GM_CSF, are the unique characteristics of the largest CD8+ TN+ TCM. At the same time, the combination of higher glycine but lower IL13 with other drugs showed the largest CD4+ TN+ TCM prediction (Figure 2).
CPP and CQA candidates need to be consistently selected for T cell memory. Here, when considering the features with the highest importance scores in all models, TNFα was consistently found in all seven ML methods for predicting CD4+/CD8+ TN+ TCM (Figure 3a; method). Other characteristics, such as IL2R, IL4, IL17a and DMS concentration, are usually selected by the method ≥5ML (Figure 3a, c). In addition, it was found that using SR in combination with IL13 and IL15 has predictive significance (see Table S4).
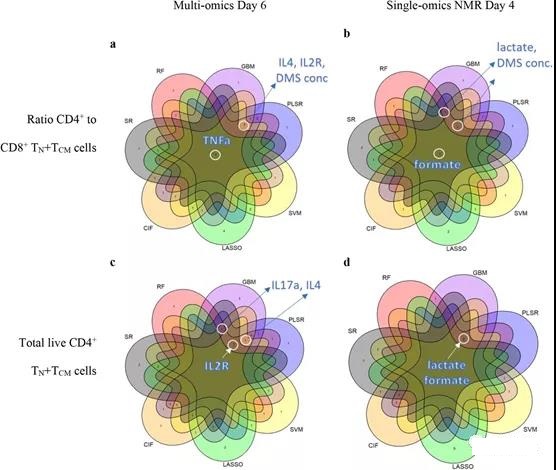
Figure 3. Consensus of a highly predictive ML model for early monitoring of T cell manufacturing. ML reached a consensus on the a-b ratio of CD4+ and CD8+ TN+ TCM cells and c-d total viable CD4+ TN+ TCM cells in the multi-omics model on day 6 and the NMR group on day 4. The displayed feature name agrees with the 5 or more ML models with the highest ranking.
This comprehensive analysis of cytokines and NMR media analysis performed in the early stages of the T cell process provides a highly predictive combination of characteristics of the final product quality. However, when converting a real-time monitoring strategy to a large-scale production process, it is difficult and expensive to measure cytokine and NMR characteristics from the medium. In order to be cost-effective and translatable, Scientists have demonstrated that predictive features can be found only through cytokine spectroscopy or NMR media analysis without affecting the predictive performance.
IV. Cytokine media profile for early prediction
Compared with the multi-omics model, the ML model that only uses the culture medium cytokine profile on the 6th day achieves similar or higher R2 (CD4+ TN+ TCM: 71.4%-99.9%; CD4+/CD8+: 83.4%-99.7% ). However, CD8+ TN+ TCM still has variable LOO-R2, which is 7.8%-93%. In general, the higher cytokine medium profile shows higher CD4+ TN+ TCM and therefore its ratio to CD8+ (Figure 4a).
For TNFα, IL2R, IL17a, and IL4, this behavior is obvious even after the 6th day, and these TNFα, IL2R, IL17a, and IL4 are often selected as predictive features across models (Figure 4b-c; appendix figure) S20). For CD8+ TN+ TCM, more complex behaviors were detected, which cannot be explained by the secretion of cytokines alone (Figure 4d).
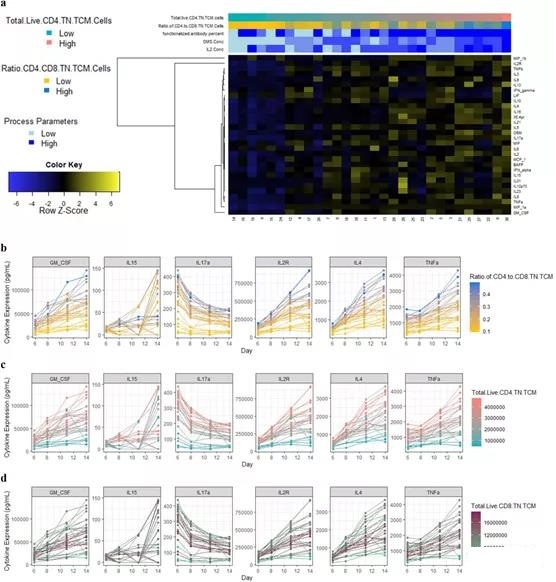
Figure 4. General characteristics of the cytokine medium profile. a Heat map of the cytokine profile from the culture medium sample on day 6. The picogram/ml expression across time points, b represents the ratio of CD4+ and CD8+ TN+ TCM cells, c total live CD4+ TN+ TCM cells and d total live cell-related factors characteristic CD8+ TN+ TCM units.
V. NMR media analysis for early prediction
Compared with the multi-omics model and the cytokine model, the model using only the NMR medium intensity on the 6th day showed that R2 decreased by 8.8% and 11.1% on average, respectively. However, SR, GBM and PLSR reached a very high LOO-R2 (92.1%-99%), especially CD4+/CD8+ and CD4+ TN+ TCM. Although good predictions were obtained by NMR media analysis on the 6th day, better predictions were obtained by NMR media analysis on the 4th day (Table 1). From these models, formate, lactate, and DMS concentrations can highly predict the ratio of CD4+/CD8+ and CD4+ TN+ TCM (Figure 3b, d; Supplementary Figure 19d). Some variable combinations also include histidine, ethanol, dimethylamine, branched chain amino acids (BCAA), glucose and glutamine (see Table S3).
In different media monitoring time, lower BCAA, dimethylamine, glucose and glutamine intensity values showed higher CD4+ TN+ TCM cells (Figure S25). On the contrary, over time, higher formic acid and lactic acid intensities showed higher CD4+ TN+ TCM and its ratio to CD8+ (Figure 5a, b).
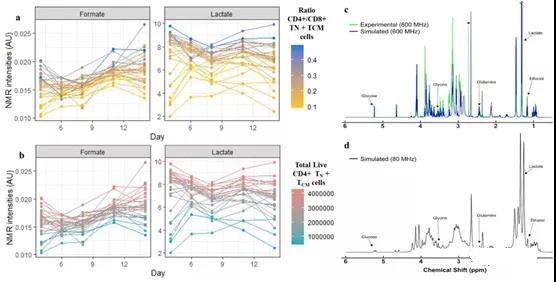
Figure 5. Best performing NMR media analysis.
Summary:
Researchers have developed an artificial intelligence (AI)-driven experimental computing platform to identify a set of critical process parameters (CPP) and critical quality attributes (CQA) from heterogeneous, high-dimensional, multiple sets of time-related The data can be measured in the early stages of manufacturing, and the quality of products at the end of manufacturing can be predicted.
Research based on sequential design of experiments (DOE) is used in conjunction with an unknowable machine learning framework to extract feature combinations from media evaluations. These feature combinations can highly predict pure CD4+ and CD8+ naive and central memory (CD63L+CCR7+) T cells and Its proportion in the final product. This computational workflow can be widely used in any cell therapy and provides a roadmap for the discovery of CQA and CPP in cell manufacturing.
(source:internet, reference only)
Disclaimer of medicaltrend.org