2011-2020 Clinical development success rate and contributing factors
- Normal Liver Cells Found to Promote Cancer Metastasis to the Liver
- Nearly 80% Complete Remission: Breakthrough in ADC Anti-Tumor Treatment
- Vaccination Against Common Diseases May Prevent Dementia!
- New Alzheimer’s Disease (AD) Diagnosis and Staging Criteria
- Breakthrough in Alzheimer’s Disease: New Nasal Spray Halts Cognitive Decline by Targeting Toxic Protein
- Can the Tap Water at the Paris Olympics be Drunk Directly?
2011-2020 Clinical development success rate and contributing factors
- Should China be held legally responsible for the US’s $18 trillion COVID losses?
- CT Radiation Exposure Linked to Blood Cancer in Children and Adolescents
- Can people with high blood pressure eat peanuts?
- What is the difference between dopamine and dobutamine?
- What is the difference between Atorvastatin and Rosuvastatin?
- How long can the patient live after heart stent surgery?
2011-2020 Clinical development success rate and contributing factors.
On February 2, 2021, the trade association BIO of biotechnology companies, academic institutions, national biotechnology centers and related organizations, and QLS Advisors (quantitative life science consulting company) jointly released the latest 10 years of clinical research and development based on the Informa Pharma Intelligence database Biomedtracker A report on the success rate and its contributing factors.
BIO cooperated with a group of data scientists from QLS Advisors, based on its 2016 report on the success rate of clinical drug development, and used machine learning (ML) and artificial intelligence (AI) technologies to quantitatively evaluate drugs approved in clinical trials The characteristics that have the greatest impact, analyze and predict the factors that contribute to drug development.
From the 1,779 companies in the Biomedtracker database in the past ten years (2011-2020), 12,728 clinical and approval transitional drugs out of 9,704 clinical drug R&D projects were recorded and analyzed.
By calculating the ratio of the number of candidate drugs entering the next phase to the total amount suspended by the sponsor, the success rate of drug development in the four phases of phase I, phase II, phase III and regulatory filing is evaluated. Use these data to compare the effects of different diseases, drug models and other factors on drug development, and finally form a more comprehensive comprehensive analysis report that affects the success of biopharmaceutical research and development.
One of the key success indicators used in the report is the overall likelihood of approval (LOA). The LOA success rate is multiplied by the success rates of all four clinical trial phases to calculate the compound probability.
For example, if each phase of a clinical trial has a 50% probability of success, then the LOA for the first phase will be 0.5 x 0.5 x 0.5 x 0.5 = 6.25%.
Analysis found
The overall likelihood of approval (LOA) for phase I of all drug candidates from 2011 to 2020 is 7.9%, while the data from 2006 to 2015 is 9.6%;
Phase II is still the biggest obstacle to drug development, with only 28.9% of drug candidates entering the next phase;
Among the 14 main diseases, hematology treatment started with the highest LOA (23.9%), which was 7 times that of urology (3.6%), which had the lowest success rate.
Immuno-oncology therapies have achieved rare success in the development of tumor drugs. The overall LOA is 12.4%, while the LOA of all tumor therapies is 5.3%.
Rare disease drugs are very successful, with an overall LOA of 17.0%.
Chronic and high-incidence disease drugs are not very successful, with an overall LOA of 5.9%.
The biological complexity of drug forms usually leads to higher LOA, with CAR-T and RNA interference reaching the highest LOA of 17.3% and 13.5%, respectively.
Research and development projects that use patient preselected biomarkers for trials have twice as high LOA (15.9%), and the phase II clinical success rate is close to 1/2.
The primary factors for success are disease indications, targets, morphology and drug innovation.
In terms of development time, it takes an average of 10.5 years from phase I clinical to approval, which includes 2.3 years for phase I clinical trials, 3.6 years for phase II clinical trials, 3.3 years for phase III clinical trials, and 1.3 years for the approval phase. Diseases with higher than average LOA tend to have the shortest development time.
Possibility of Approval (LOA)-by disease
This report found that the success rate of Phase II clinical trials is far lower than any other phase.
The success rate of phase I and phase III clinical phase is significantly higher than that of phase II clinical phase, and phase I is slightly lower than phase III.
The highest success rate among the four R&D stages is the new drug application (NDA)/biological license application (BLA) filing stage (Figure 1).
The success rate of stage I was 52.0% (n=4414). Since this stage is usually used for safety testing, the success rate of this stage is usually higher.
However, the success rate of Phase I may also be because some of the larger companies will not make the failed Phase I plan public.
The success rate of phase II (28.9%, n=4933) was significantly lower than that of phase 1, and was the lowest among the four research phases.
Among all stages, the success rate of Phase II is always the lowest. This is also a key point in drug development.
The industry must decide whether to conduct a large, expensive phase III clinical study or terminate development-this may be for a variety of reasons, including commercial feasibility.
The second highest conversion success rate occurred in Phase III (57.8%, n=1928).
This is significant because most company-sponsored Phase III clinical trials are the longest and most expensive trials to conduct.
After submitting an NDA or BLA, considering resubmission, the probability of FDA approval is 90.6% (n=1453).
The overall conversion success rate of drug clinical research is shown in Figure 1.
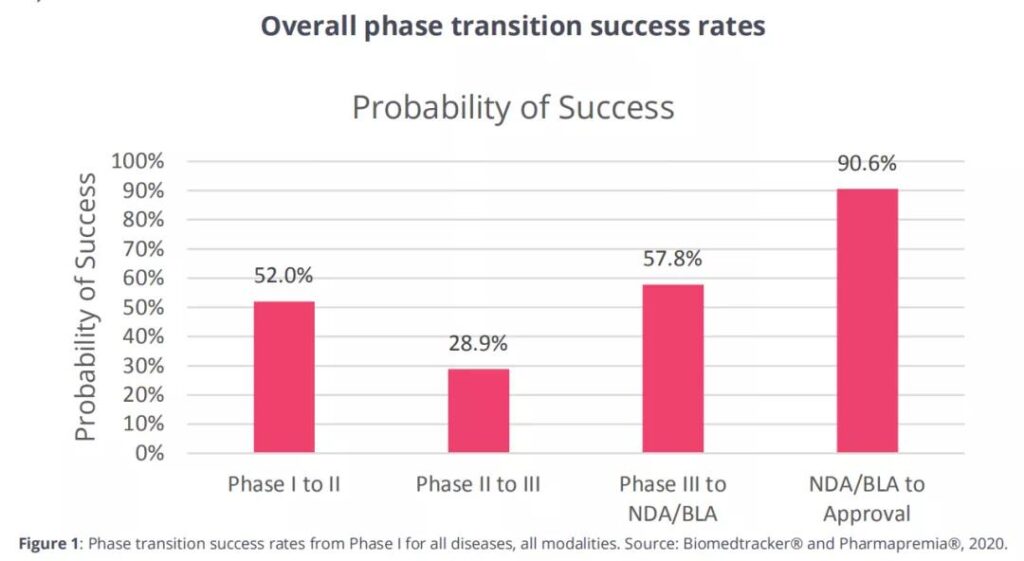
Figure 1 The overall conversion success rate of drug clinical research throughout the cycle
The success rate of entering the next phase by disease type
The major diseases are classified according to the Biomedtracker usage rules, and 21 major diseases and 623 indications are included in the 2011-2020 report.
In Figure 2, 14 major disease categories are analyzed: allergies, autoimmunity, cardiovascular, endocrine, gastroenterology (non-IBD), hematology, infectious diseases, metabolism, neurology, oncology, ophthalmology, psychiatry Science, Respirology and Urology.
The remaining diseases include dermatology, nephrology, obstetrics, rheumatism (non-autoimmune indications), otolaryngology/dentistry and orthopedics are classified as “other”.
There are 573 indications under these major diseases. It will be analyzed and discussed in the next report.
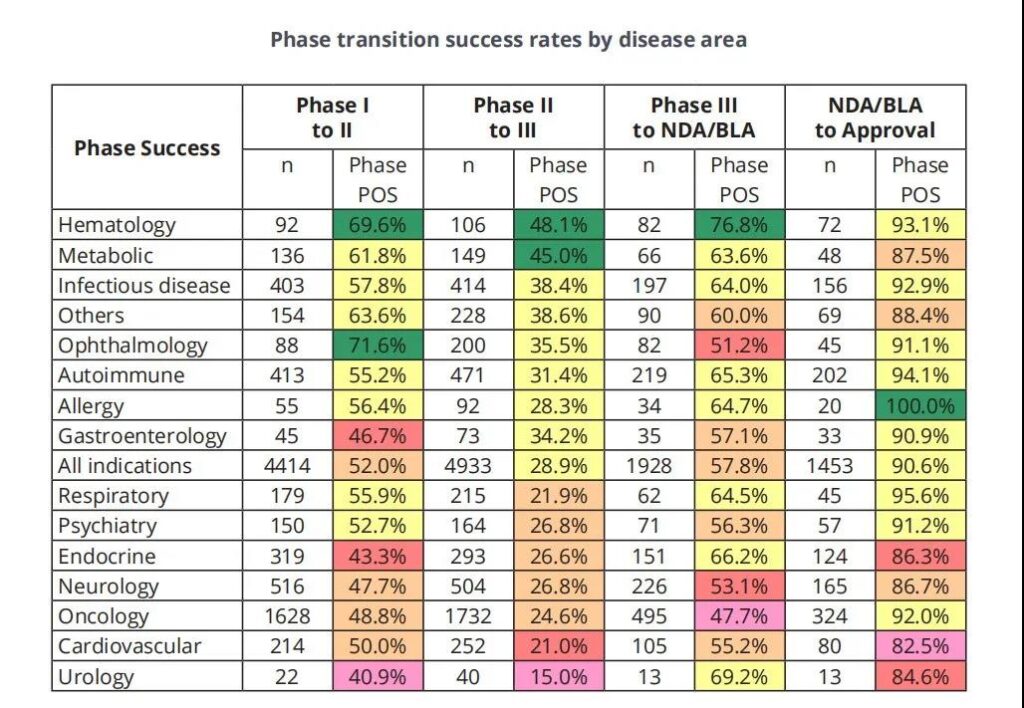 Figure 2 The success rate of entering the next phase by disease type. *The n value is used to calculate the total “entry or pause” transitions for all phases of the LOA. “POS” is the probability of successfully entering the next stage. The order of disease types is consistent with the overall likelihood of approval in the first phase.
Phase I conversion success rate
The success rate of each disease in stage I is between 40.9% and 71.6%, and the average success rate of all diseases is 52.0%.
Both ophthalmology and hematology were above average, 71.6% (n=88) and 69.6% (n=92), respectively.
Except for these two major diseases, the rest are within a reasonable average range.
Phase II conversion success rate
The stage II transition success rate of each disease is the lowest, ranging from 48.1% (hematology, n=106) to 15.0% (urology, n=40). As shown in Figure 3.
The 33% gap between the main diseases is the main cause of the observed overall likelihood of approval (LOA) difference, which will be discussed in the next section.
Only hematological diseases and metabolic diseases (45.0%) have a success rate close to 1/2.
These two diseases are also higher when calculating the overall LOA of stage I, as shown in Figure 5 below.
Similar to stage I, the drug diseases with the lowest transition success rate in stage II are urology, cardiovascular (21.0%) and oncology (24.6%).
Compared with the success rate of stage I, the success rate of gastrointestinal disease in stage II is higher (34.2%), which is higher than the average level of all indications.
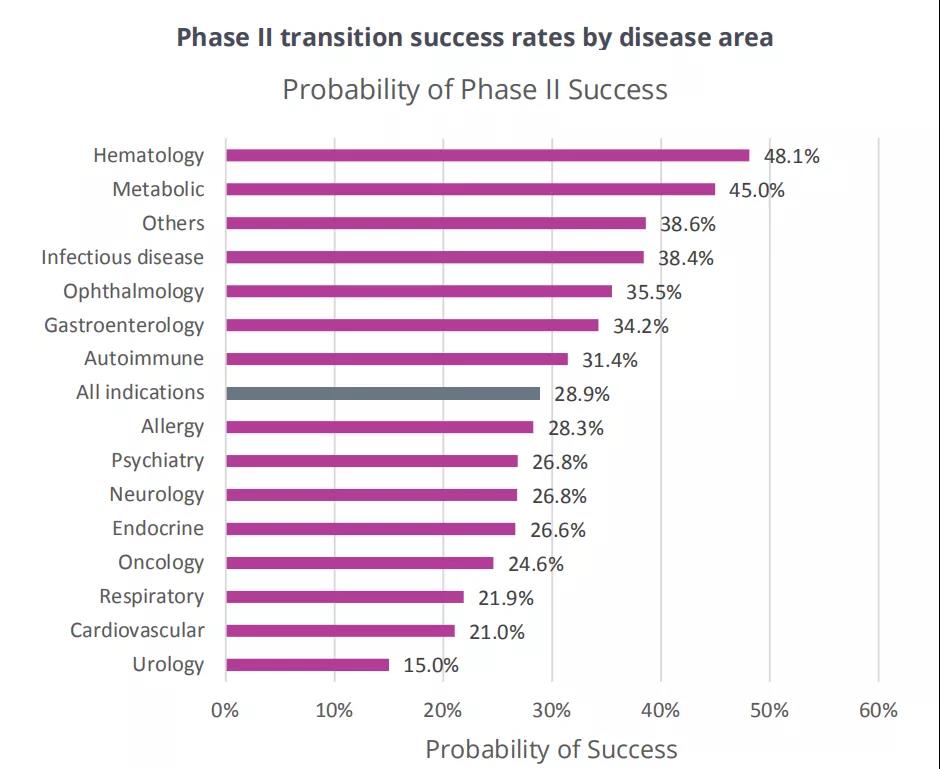
Figure 3 Phase II transition success rate by disease category
Phase III conversion success rate
The stage III transformation success rate was the lowest in oncology (47.5%, n=495). As shown in Figure 4, the phase III transition success rates of the remaining 13 specific diseases are all above 50%.
In addition to oncology, there are five other diseases whose stage 3 transformation success rate is lower than the average level of 57.8%, including ophthalmology (51.2%, n=82), whose early performance is better than the average of all diseases.
In contrast, urology has the lowest conversion success rate in phases I and II, and its success rate in phase III ranks second (69.2%, despite the low n-value of 13), second only to hematology.
All disease groups with lower-than-average stage III success rates have a large number of patients.
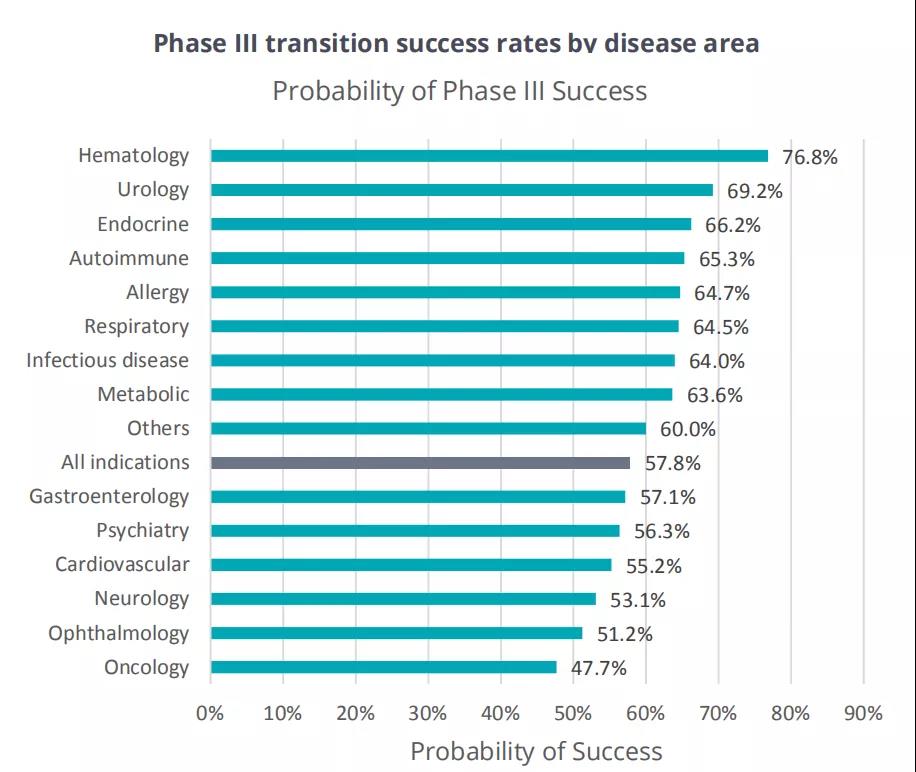 Figure 4 The success rate of phase III transformation by disease
NDA/BLA submission success rate
The NDA/BLA conversion success rate (approval rate) for major diseases ranges from 82.5% (cardiovascular) to 100.0% (allergic). These ratios refer to the ultimate success, not the result of the first review.
In some cases, the approval process has more than two complete response letters (CRL) and attempted approval.
This unlimited number of submission attempts resulted in an overall success rate of over 90.6% for all diseases, and during the 2011-2020 approval transition period, only 137 drugs were suspended by sponsors (hence 1316 approvals).
In the clinical development projects analyzed, the proportion of approved innovative drugs and non-innovative drugs is roughly equal, including 740 innovative drugs (435 new molecular entities (NMEs), 278 new biological agents and 27 vaccines) and 576 Non-initiated drugs (453 non-NMEs and 123 bioequivalent drugs).
Development time
From 2011 to 2020, the average cycle time for 6,151 drugs from phase I development to final approval is 10.5 years.
This includes 2.3 years for phase I clinical trials, 3.6 years for phase II clinical trials, 3.3 years for phase III clinical trials, and 1.3 years for the approval phase.
Diseases with higher than average LOA tend to have the shortest development time.
The length of drug clinical trial period varies greatly due to many factors, such as different diseases and indications, best practices of clinical trial design, and patient accessibility.
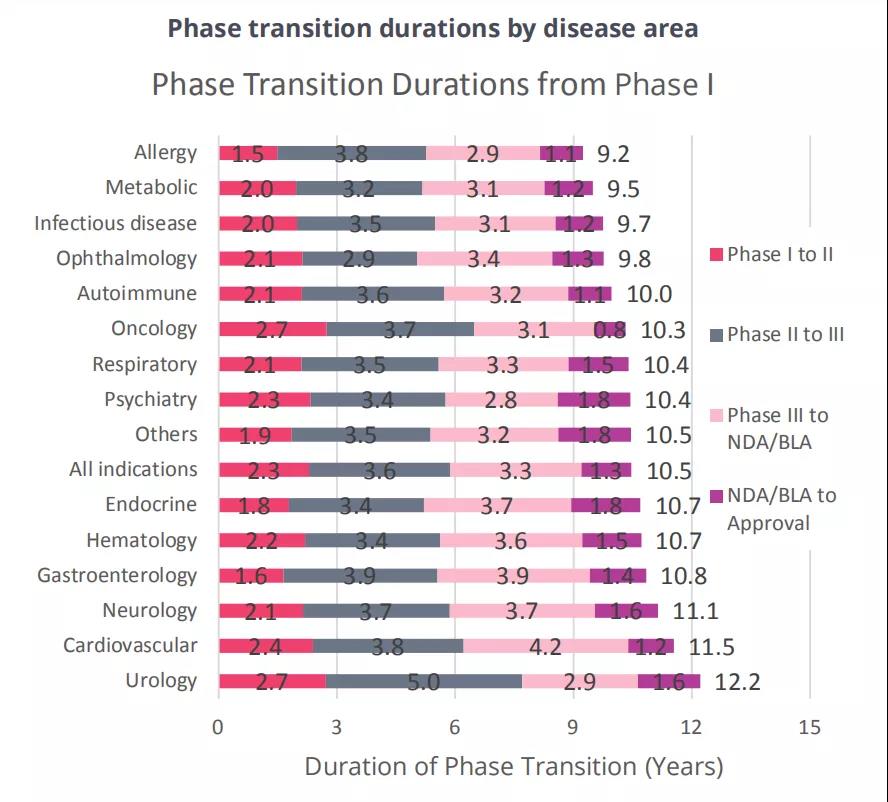 Figure 5 The development cycle of the main 14 disease drugs
2011-2020 Clinical development success rate and contributing factors
(source:internet, reference only)
Disclaimer of medicaltrend.org