Introduction to Phase I clinical trials of CD19-CD22 CAR-T Cell Therapy
- Normal Liver Cells Found to Promote Cancer Metastasis to the Liver
- Nearly 80% Complete Remission: Breakthrough in ADC Anti-Tumor Treatment
- Vaccination Against Common Diseases May Prevent Dementia!
- New Alzheimer’s Disease (AD) Diagnosis and Staging Criteria
- Breakthrough in Alzheimer’s Disease: New Nasal Spray Halts Cognitive Decline by Targeting Toxic Protein
- Can the Tap Water at the Paris Olympics be Drunk Directly?
Introduction to Phase I clinical trials of CD19-CD22 CAR-T Cell Therapy
- Should China be held legally responsible for the US’s $18 trillion COVID losses?
- CT Radiation Exposure Linked to Blood Cancer in Children and Adolescents
- FDA has mandated a top-level black box warning for all marketed CAR-T therapies
- Can people with high blood pressure eat peanuts?
- What is the difference between dopamine and dobutamine?
- How long can the patient live after heart stent surgery?
Introduction to Phase I clinical trials of CD19-CD22 CAR-T Cell Therapy.
Introduce
Although CAR-T cell therapy has made remarkable progress, more than 50% of patients treated with CD19-targeted chimeric antigen receptor T cells (CAR19) still have disease progression. Of the 16 large B-cell lymphoma (LBCL) patients whose disease progressed after CAR19 treatment, 10 had no or low CD19. The decrease of CD19 density on the cell surface is associated with disease progression.
In order to prevent the recurrence of CD19- or CD19lo disease, we tested the bispecific targeting CD19 and/or CD22 (CD19-22.BB.z-CAR) in the Phase I clinical trial of adult relapse/refractory B (NCT03233854) Sex CAR cell acute lymphoblastic leukemia (B-ALL) and LBCL.
Results
Axicabtagene ciloleucel resistance is associated with CD19- and CD19lo LBCL. To assess whether resistance to CAR19 therapy in LBCL is associated with CD19-/lo recurrence, in our institution, semi-quantitative qualitative immunohistochemistry (IHC) H score was used to measure the acceptance of axicabtagene ciloleucel (axi-cel). Our subjects included 44 consecutive patients treated with axi-cel, and these patients had available IHC pretreatment tissue biopsies.
The median follow-up was 21 months (95% confidence interval (CI) 11-24), and the median progression-free survival (PFS) was 6.1 months (95% CI 3.1—unestimable); 23 patients (52%) experienced Made progress. 16 of the 23 progressing patients underwent post-progression biopsy.
Before axi-cel, the median CD19 H score was 285 (interquartile range (IQR) = 240-285) (Figure 1a). Using an H score cutoff of 150 to indicate CD19 positive, 39 (89%) patients were CD19+ before treatment. CD19 positivity is not associated with a long-lasting response (Fisher’s exact test P=1). In contrast, only 6 of the 16 samples studied (37.5%) were CD19+ at the time of disease progression. Among patients with paired H scores before and after treatment, 9 15 (60%) patients converted from CD19+ to CD19- before treatment at relapse (McNemar test P=0.003) (Figure 1b).
Some advanced biopsies showed complete loss of CD19, while other biopsies showed reduced CD19 expression (Figure 1c). In addition, treating the H score before treatment as a continuous variable also shows that there is no difference between patients with persistent disease control and patients with disease progression (t-test P=0.32).
These data indicate that progression after axi-cel treatment for LBCL is associated with CD19-/lo disease in a high percentage of patients, but pre-treatment semi-quantitative IHC measurement of CD19 expression does not identify patients at risk of recurrence.
In order to assess whether the quantitative evaluation of CD19 cell surface density can predict the results after axi-cel and try to define the threshold level of antigen expression associated with recurrence, we used quantitative flow cytometry to measure the live single cell suspension obtained by fine needle aspiration The CD19 site density. As shown in Figure 1d, Preaxi-cel LBCL showed a significant difference in the density of CD19 sites within and between patients.
The figure shows LBCL from two representative patients. According to the IHCH score, they are both CD19+. The median CD19 site density of patient A116 was 6,538 molecules per cell and had undergone durable disease control; in contrast, the median CD19 site density of patient A140 was 952 molecules per cell, and was He experienced disease progression 3 months after CR. The median preaxi-cel CD19 site density (n=15) using quantitative flow cytometry was 6,396 moles per cell (IQR = 3647-8540), and the range was 952-46,805 moles per cell (Figure 1e).
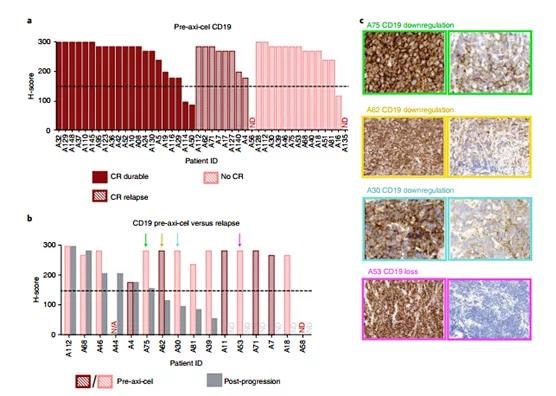
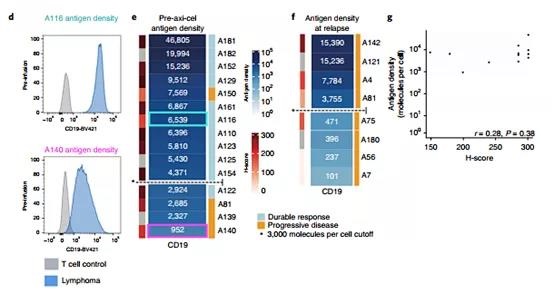
Figure 1 | IHC proved that CD19-/lo disease postaxi-cel and quantitative flow cytometry formal LBCL preaxi-cel treatment are associated with disease progression.
Using a penalty logistic regression model, patients with a low median CD19 site density before treatment had a significantly increased risk of progression after axi-cel (P = 0.03), and a patient with 2,934 CD19 molecules per cell had a 50% risk of progression. Therefore, , We choose 3,000 molecules per cell as the cut-off value to define CD19 positivity.
In our cohort, 3 out of 4 LBCL patients expressing ≤3,000 CD19 molecules per cell experienced progression, and 1 out of LBCL patients expressing >3,000 molecules per cell experienced disease progression. Among the 8 patients studied after the axi-cel progression, 4 showed a CD19 site density ≤3,000 molecules per cell (Figure 1f and expanded data Figure 2). The correlation between H score and antigen site density is not good (Spearman r=0.28, P=0.38; Figure 1g and expanded data Figure 2). These data confirm that the emergence of CD19-/lo LBCL is the main cause of resistance to CAR19 treatment, which indicates that LBCL with a median expression of ≤3,000 mol ecules before treatment has an increased risk of recurrence, which improves the prospect of quantitative flow. Cytometry, rather than IHC, can a priori identify LBCL patients at risk of CD19-/lo recurrence after CAR19.
In order to assess whether the quantitative evaluation of CD19 cell surface density can predict the results after axi-cel and try to define the threshold level of antigen expression associated with recurrence, we used quantitative flow cytometry to measure the live single cell suspension obtained by fine needle aspiration The CD19 site density. As shown in Figure 1d, Preaxi-cel LBCL showed a significant difference in the density of CD19 sites within and between patients. The figure shows LBCL from two representative patients. According to the IHC H score, they are both CD19+. The median CD19 site density of patient A116 was 6,538 molecules per cell and had undergone durable disease control; in contrast, the median CD19 site density of patient A140 was 952 molecules per cell, and the initial He experienced disease progression 3 months after CR. The median preaxi-cel CD19 site density (n=15) using quantitative flow cytometry was 6,396 moles per cell (IQR = 3647-8540), and the range was 952-46,805 moles per cell (Figure 1e).
Using a logistic regression model, patients with a low median CD19 site density before treatment had a significantly increased risk of progression after axi-cel (P = 0.03), and the patient’s risk of progression with 2,934 CD19 molecules per cell was 50%. Therefore, we Choose 3,000 molecules per cell as the cutoff value to define CD19 positivity.
In our cohort, 3 out of 4 LBCL patients expressing ≤3,000 CD19 molecules per cell experienced progression, and 1 out of LBCL patients expressing >3,000 molecules per cell experienced disease progression. Of the 8 patients studied after axi-cel progressed, 4 showed a CD19 site density ≤3,000 molecules per cell. The correlation between H score and antigen site density is not good (Spearman r=0.28, P=0.38; Figure 1g).
These data confirm that the emergence of CD19-/lo LBCL is the main cause of resistance to CAR19 treatment, which indicates that LBCL with a median expression of ≤3,000 mol ecules before treatment has an increased risk of recurrence, which improves the prospect of quantitative flow. Cytometry, rather than IHC, can a priori identify LBCL patients at risk of CD19-/lo recurrence after CAR19.
The CAR construction, closed system production and product release characteristics, clinical design and patient characteristics are shown in Figure 2.
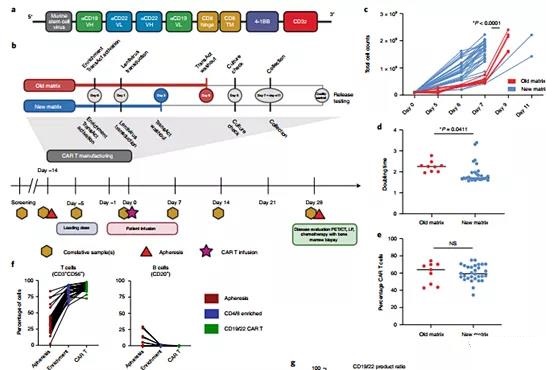
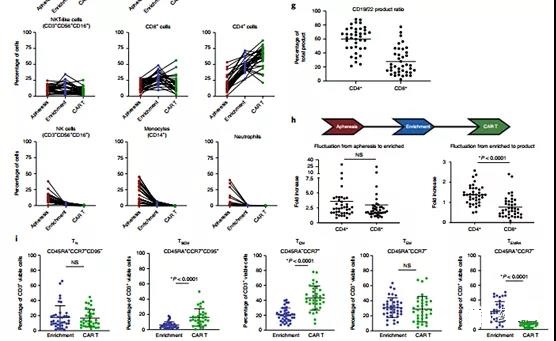
Figure 2 | Characterization of CAR products throughout the manufacturing process reveals changes in composition and phenotype. a, CD19-22-CD8. BB.z-CAR contains CD19 FMC63 and CD22 M971 scFv, CD8α hinge and transmembrane domain, 4-1BB costimulatory domain and CD3ζ domain. The unique bispecific structure shows the proximal end of the FMC63 heavy chain, followed by the M971 light chain, the M971 heavy chain, and the distal end of the FMC63 light chain. b, CAR T manufacturing and clinical trial plan. The manufacturing model shows the transformation of the TransAct process from the old matrix to the new matrix. The clinical trial protocol showed screening, lymphocyte depletion, CAR T cell infusion, and disease assessment time point c. Compared with the old matrix, the culture expansion caused by the new matrix manufacturing process was improved (P <0.0001, two-tailed t test) . d. Compared with the old matrix, the doubling time of the new matrix process is significantly reduced (P = 0.0411, two-tailed t test). e. There is no significant difference in transduction efficiency between the old and new matrices (P = not significant (NS), two-tailed t test). The overall average transduction efficiency is 60.1% (n = 39 individual products). f. Blood separation, CD4/8 enrichment and the composition of CD19-22.BB.z products over time, observe T cells (CD3+CD56−), B cells or leukemia cells (CD20+), CD4+, CD8+, NKT-like ( CD3+CD56+CD16+), NK, monocytes and neutrophil subpopulations. g, The phenotypic analysis of CAR T cell products showed a tilt toward CD4+ cells (n=39 individual products). h. Comparing the fold increase from apheresis to enrichment to final product reveals the tilt towards CD4+ cells that occurred during the culture process between enrichment and final product (P <0.0001, two-tailed t test). i. Phenotypic analysis of T cell memory subpopulations showed the enrichment of TSCM (P <0.0001, two-tailed t test) and TCM (P <0.0001, two-tailed t test) cell subpopulations and TEMR (P <0.0001, two-tailed t test) t test) subset. There was no significant change in the TN or TEM cell subpopulations between the enrichment and CD19-22.BB.z products.
Clinical trial results:
Toxicity.
No dose-limiting toxicity (DLT) occurred during the dose escalation, and a total of 1 DLT occurred during the clinical trial. Cytokine release syndrome (CRS) of any grade occurred in 29 patients (76%), with a median onset of 1 day after infusion and lasting 4 days (Tables 1 and 2). 5). 2 patients (5%) ≥3 CRS. Neurotoxicity occurred in 14 patients (37%; 9 patients had LBCL and 5 patients had B-ALL); 4 patients experienced neurotoxicity ≥ Grade 3. The median episode of neurotoxicity was 5 days after the infusion (range 3-9) and lasted for a median of 4 days. Both CRS and neurotoxicity were treated according to institutional guidelines, with 15 patients (39%) receiving ≥1 dose of tocilizumab and 45% of patients receiving corticosteroids. All CRS and neurotoxic episodes are resolved. Two patients had laboratory evidence of macrophage activation syndrome, with methemorinemia and hypofibrinogenemia, and with neurotoxicity of grade ≥3, and received high-dose corticosteroids and anakinra White.
Reaction.
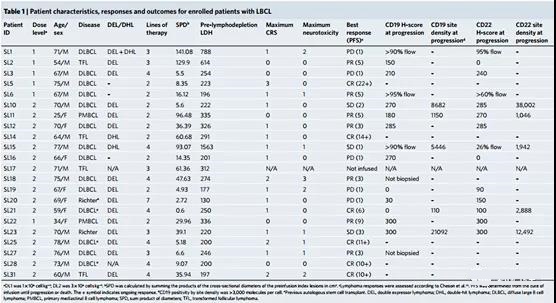
The main response assessment of LBCL is performed three months after the infusion. For LBCL patients treated at the recommended phase II dose (n=15), the overall response rate (ORR) and CR rates at 3 months were 40% (95% CI 16–68%) and 33% (95% CI 12) –62%), respectively. For the entire LBCL patient cohort (n=21), the optimal ORR at any time point was 62% (95% CI 38-82%), and the CR rate was 29% (95% CI 11-52%). Five of the 13 responders improved their response from the first month to the third month after the infusion (Figure 3a-c).
The median follow-up time was 10 months (95% CI 8.7-21.5), and the median overall survival was 22.5 months (95% CI 8.3-not estimable; Figure 3d), which may change with longer follow-up time Change. The median PFS was 3.2 months (95% CI 1.2-5.5; Figure 3e). To understand the response kinetics of LBCL patients treated with CD19-22.BB.z, we used cell-free circulating tumor DNA (ctDNA) to evaluate the lymphoma burden over time in 16 patients with available diagnostic tumor samples.
At the last evaluation, no ctDNA was detected in the four patients with sustained clinical response. In 12 patients with disease progression, we observed an initial decrease in ctDNA, reaching the lowest point 14-21 days after infusion, and 9 patients showed an increase in ctDNA at or before clinical progression. These findings indicate that the progressive disease after CD19-22.BB.z-CAR in LBCL is related to strong early response and early acquired drug resistance.
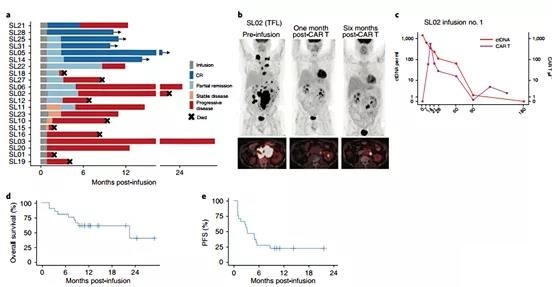
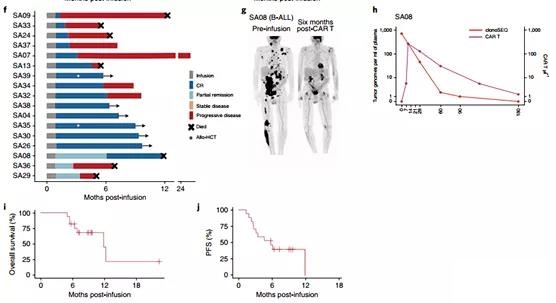
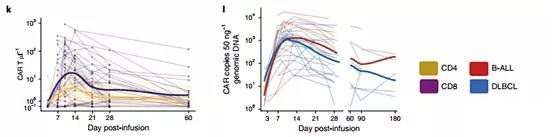
Figure 3 | CD19-22.BB.z-CAR is active in LBCL and B-ALL.
The main response to B-ALL was evaluated 28 days after the infusion.
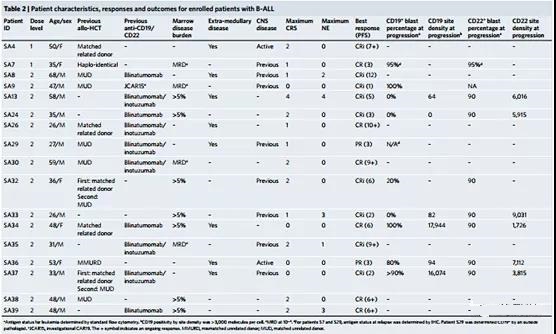
All (n=17) B-ALL patients achieved remission; 14 cases achieved CR (82%), and 3 cases achieved partial remission (Figure 3f). One patient’s response (SA8) improved to CR 6 months after infusion (Figure 3g, h), resulting in an overall CR rate of 88%. All these patients had minimal residual disease (MRD) at 10-4 bone marrow sensitivity. ) Are all negative (extended data in Figure 7) or positron emission tomography (PET)/computed tomography (CT) for patients with extramedullary disease. After a median follow-up of 9.3 months (95% CI 7.2-NE), the median overall survival was 11.8 months (95% CI 5.5-NE) (Figure 3i), and the PFS was 5.8 months (95% CI 2.6-NE) ) (Fig. 3j). Two patients underwent allogeneic stem cell transplantation in CR and are currently in remission. A series of MRD analyses performed by next-generation sequencing (NGS) of immunoglobulin receptors from bone marrow showed that 100% (5 out of 5) patients with continuous CR achieved sustained negative MRD responses, while 70% (7 out of 10) progressors persisted or increased MRD before or during morphological recurrence.
In vivo quantification of CD19-22.BB.z CAR T cells.
CD19-22.BB.z-CAR cells were detected in the blood by flow cytometry and quantitative PCR (qPCR), and reached a peak value between 10-14 days after infusion (Figure 3k, l). The median peak value of circulating CD19-22.BB.z cells measured by flow cytometry is 36CARμl-1 (IQR=13-136); by qPCR, there are 1,794 (IQR=509-4,315) cells per 50 ng of genomic DNA A copy of CD19-22.BB.z is transgenic. There was no significant difference in peak spread between LBCL and B-ALL or dose levels. The higher expansion measured by the area under the curve (AUC) is associated with increased CRS and neurotoxicity. Although CD4+ cells are predominant in the manufactured CD19-22.BB.z-CAR products, measured by AUC and peak level, CD8 CD19-22.BB.z cells showed greater expansion relative to CD4 and as in It is seen by the peak CD4:CD8 ratio of <1 in most patients. The analysis of CAR+ cell depletion markers in the product shows that CD4+ cells express higher levels of CD39 and programmed cell death protein 1 (PD-1)), which may be the expansion of CD4+ in vivo compared with CD8+ CAR T cells Reduce.
Antigen expression in patients with disease progression after CD19-22.
BB.z-CAR. We next quantified the expression of CD19 and CD22 antigens during the progression of CD19-22.BB.z-CAR. Flow cytometry, as shown in patient SA24 (Figure 4a), uses a 90% threshold (Figure 4b and Table 2). The quantitative pairing of antigens before and after treatment of four B-ALL patients confirmed that the expression of CD19 was reduced in three patients, while the expression density of CD22 did not change (Figure 4c).
Among the 14 patients with advanced LBCL biopsy, the IHC of 3 patients was CD19-/lo. Trial recruitment does not require CD22 expression, and CD22 expression before treatment is heterogeneous; three patients have CD22-/lo LBCL, and two patients are undetermined. All 6 patients with a CD22 H score >150 before treatment remained CD22 positive. Eleven patients with B-ALL or LBCL underwent quantitative titration flow cytometry as they progressed; 6 patients had low CD19 with ≤3,000 molecules per cell (Figure 4d), of which 1 patient with LBCL had a CD19 H score >150 . Patients with low CD19 have a median CD22 expression of approximately 6,000 molecules per cell.
Overall, 4 of 14 LBCL patients (29%) developed CD19-/lo after treatment with CD19-22.BB.z-CAR.
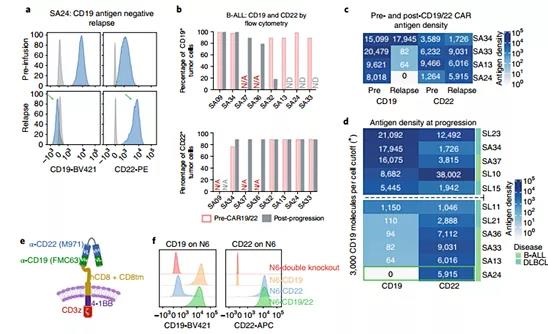
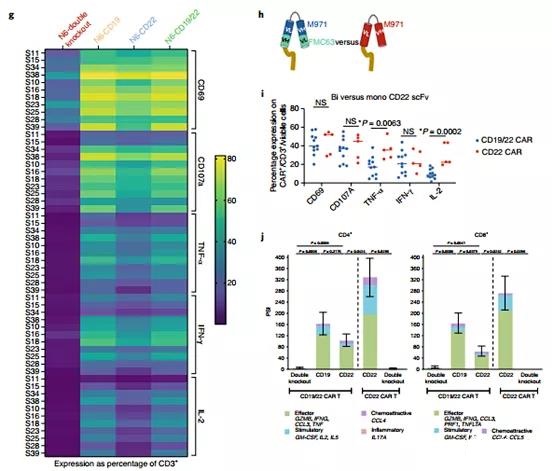
Figure 4 | CD19 negative recurrence, the CD22 site density remains unchanged after CD19-22.BB.z-CAR, and the function of CAR T on CD22 is weakened.
When stimulated by CD22 scFv, CD19-22.BB.z-CAR T secretes fewer cytokines. The pattern of CD19-/lo recurrence and CD22 retention indicates that T cells expressing CD19-22.BB.z-CAR exert significant immune pressure on CD19, but not on CD22. The in vitro model proved that CD19-22.BB.z-CAR has activity on CD19/CD22+ cell lines. To solve this problem, we used a single-cell assay to compare the relative potency of the signal delivered by CD19 scFv with the CD22 scFv in CD19-22.BB.z-CAR (Figure 4e).
Using samples from 11 manufactured cell products, we measured the difference between CD19-22.BB.z-CAR T cells and double-positive NALM6 (N6-CD19/22, approximately 20,000 CD19 molecules/cell and approximately 50,000 per cell CD22 molecules), NALM6, where CD22 is knocked out by CRISPR-Cas9 (N6-CD19, about 20,000 CD19 molecules per cell, 0 CD22 molecules per cell), NALM6, where CD19 is knocked out by CRISPR-Cas9 ( N6-CD22, approximately 40,000 CD22 molecules per cell, 0 CD19 molecules per cell) or NALM6, where both CD19 and CD22 are genetically deleted (N6-double knockout) (Figure 4f). The densities of these sites are higher than those seen in patient samples 21, 28, and 35, and are associated with high levels of cytokine secretion in the in vitro model.
Using ICS, products manufactured by CD19-22.BB.z-CAR showed activation by CD69 expression measurement after co-cultivation with N6-CD19, but less activation with N6-CD22 (P <0.0001). Compared with N6-CD22, N6 was observed with CD107 (P<0.0001), tumor necrosis factor-α (TNFα) (P<0.0001), interleukin-2 (IL-2) (P<0.0001) and interferon -Higher expression of CD19-γ(IFN-γ) (P<0.0001) (Figure 4g). Contrary to CD19 stimulation, the decrease in PSI and ICS caused by CD22 indicates a decrease in the efficacy of CD22 scFV. We next compared the activity of the CD22 scFv of CD19-22.BB.z-CAR against the same scFV in the monospecific CD22.BB.z-CAR (Figure 4h).
We tested the CD22.BB.z-CAR T cell product (n=5) manufactured by Good Manufacturing Practice (GMP) in patients with relapsed/refractory LBCL or B-ALL from an ongoing clinical trial (NCT04088890) to Against N6-double gene knockout and N6-CD22. The average fluorescence intensity of monospecific CARs on T cells is higher than that of bispecific CARs. We found that CD19-22.BB.z-CAR and CD22.BB.z-CAR T cells showed similar levels of activation, as measured by CD69 expression and IFN-γ and CD107 secretion (Figure 4i).
However, compared with CD19-22.BB.z-CAR T cells, CD22.BB.z-CAR T cells showed significantly higher levels of TNF-α (P=0.0063) and IL-2 (P=0.0002 )secretion. Similarly, compared with CD19-22.BB.z-CAR in the presence of N6-CD22, single-cell cytokine secretion using the IsoPlexis platform showed a higher PSI of CD22.BB.z-CAR T cells (n=4; Figure 4j). After stimulating CD4 and CD8 CAR+ cells with N6-CD19/22, N6-double knockout, N6-CD19, or N6-CD22 N6 lines (n=7), a 32-fold human panel 27 was used to evaluate the secretion of single-cell cytokines. Overall, compared with N6-CD22 stimulation, N6-CD19 stimulation of CD19 produced a higher multifunctional intensity index (PSI) for testing CD8CAR+ products (P=0.04) (Figure 4j). In summary, these data indicate that both CD19 and CD22 scFv contained in CD19/22.BB.z-CAR can send signals in response to target recognition, but compared with CD19 scFv ligation, the cytokine induced by CD22 scFv ligation in the bispecific CAR The level is low. In contrast, CD22 scFv ligation in monospecific CAR results in higher levels of cytokines than bispecific CD22 scFV. The reduced potency of CD22 scFV provides a mechanism for the recurrence of CD19-/lo disease, and CD22 expression is preserved in the population studied here.
Discussion:
This work provides evidence that antigen-/lo escape is the main route of resistance after CAR19 treatment of LBCL, and the quantitative antigen density in LBCL is related to the results after CAR T cell treatment. Using a dual-specific CAR that can recognize both CD22 and CD19, we have demonstrated the safety and impressive clinical activity of B-ALL. The 6-month PFS (29%, 95% CI 12-48%) of LBCL in this trial was similar to tisagenlecleucel64.
Therefore, the lymphoma group is closed in this study, and the recruitment of B-ALL patients is underway. The resistance to bispecific CAR is related to the recurrence of CD19+CD22+, which may reflect the inherent limitations of CAR T cells, and the recurrence of CD19-/lo but CD22+, which means that the immune pressure on CD22 is insufficient. Our data also illustrates the value of cytokine production as a key product quality attribute to verify the effectiveness of CAR T cells. Future work needs to optimize the multi-specific targeting of CAR T cells to improve the efficacy of this type of therapy in B-cell malignancies and other solid and blood cancers.
doi:10.1038/s41591-021-01436-0
(source:internet, reference only)
Disclaimer of medicaltrend.org
Important Note: The information provided is for informational purposes only and should not be considered as medical advice.