5-minute delayed dual-energy CT for non-invasive staging of liver fibrosis
- Normal Liver Cells Found to Promote Cancer Metastasis to the Liver
- Nearly 80% Complete Remission: Breakthrough in ADC Anti-Tumor Treatment
- Vaccination Against Common Diseases May Prevent Dementia!
- New Alzheimer’s Disease (AD) Diagnosis and Staging Criteria
- Breakthrough in Alzheimer’s Disease: New Nasal Spray Halts Cognitive Decline by Targeting Toxic Protein
- Can the Tap Water at the Paris Olympics be Drunk Directly?
5-minute delayed dual-energy CT for non-invasive staging of liver fibrosis
5-minute delayed dual-energy CT for non-invasive staging of liver fibrosis. Liver biopsy is the current reference standard for quantifying liver fibrosis.
Chronic liver disease is an increasingly serious public health problem worldwide. About 12%-44% of patients with chronic liver disease eventually progress to advanced fibrosis and cirrhosis at different speeds. Early diagnosis of liver fibrosis will help to take necessary treatment measures to prevent and sometimes even reverse the progression of fibrosis. Therefore, the assessment of the severity of liver fibrosis has direct significance for the treatment, follow-up and risk stratification of these patients.
Liver biopsy is the current reference standard for quantifying liver fibrosis. Although biopsy provides information beyond fibrosis, it also has many disadvantages. In addition to being invasive, biopsy also carries the risk of bleeding complications and is prone to sampling errors. In addition, due to the small and hard liver of advanced disease, sampling is difficult, and there are differences between observers. It is unreasonable to repeat the biopsy to assess the changes in fibrosis. Therefore, it is necessary to develop a simple, non-invasive, reproducible and reproducible assessment method for liver fibrosis.
The detection of serum markers used to assess the severity of liver fibrosis is expensive and cumbersome, with sensitivity and specificity of 33%-96% and 29%-100%, respectively. In contrast, transient elastography (TE) and transverse wave elastography (SWE) can assess liver fibrosis by measuring liver stiffness (LS), they are simple and accurate. However, they are affected by ascites, obesity, biliary obstruction, acute inflammation, fatty liver, and intercostal stenosis. Similar to liver biopsy, only a small amount of liver is sampled. Although accurate, MRI elastography is expensive and cumbersome, is not widely available, and requires additional hardware.
DECT can assess the severity of liver fibrosis through delayed acquisition of contrast enhancement. It is assumed that the fibrous tissue of the diseased liver retains the iodinated contrast agent longer than the normal liver tissue. Therefore, the iodine concentration in the liver during the delayed DECT scan should quantify fibrosis. Regarding the role of DECT in the evaluation of liver fibrosis in chronic liver disease, there are only a few studies in the literature.
Scholars from India published an article in Radiology, aiming to evaluate the role of DECT in the staging of chronic liver disease and liver fibrosis by comparing with TE, SWE and histological examination.
This prospective study included patients with chronic liver disease who planned to undergo multiple abdominal CT and liver biopsy from January 2017 to September 2018.
Fifty individuals who were screened by kidney donors constituted a control group. Study participants underwent TE, SWE, multiphase DECT (including 5-minute delayed dual-energy scan), and liver biopsy.
The control group underwent multi-period DECT and SWE examinations. The right lobe NIC (RNIC) was compared with the liver stiffness (LS) measured by TE and SWE and the METAVIR fibrosis stage (F0~F4). The area under receiver operating characteristic curves (AUCs) was used to evaluate diagnostic performance.
Dual-energy CT imaging uses the second-generation dual-source CT (SOMATOM Definition Flash; Siemens Healthineers), kV combination 100/Sn140kV, automatic tube current modulation technology (CARE Dose4D; Siemens Healthineers). The CT parameters used are as follows: detector collimation, 64 x 0.6 mm; gantry rotation time, 0.5 seconds; pitch, 0.6; matrix, 512 x 512; reconstruction thickness, 1.5 mm; reconstruction interval, 1.5 mm; convolution kernel, D30f.
A non-ionic iodine contrast agent (Iomeron[Bracco], 400mg/ml; or Omnipaque[GE Healthcare], 350mg/ml) was injected intravenously at a speed of 4ml/s, with a total amount of 1.5ml/kg, and then images were collected in three stages. After the standard late arterial phase and portal vein phase, images of the delay phase are acquired in dual energy mode at 225 seconds after the portal phase (total delay time is 5 minutes), covering the liver.
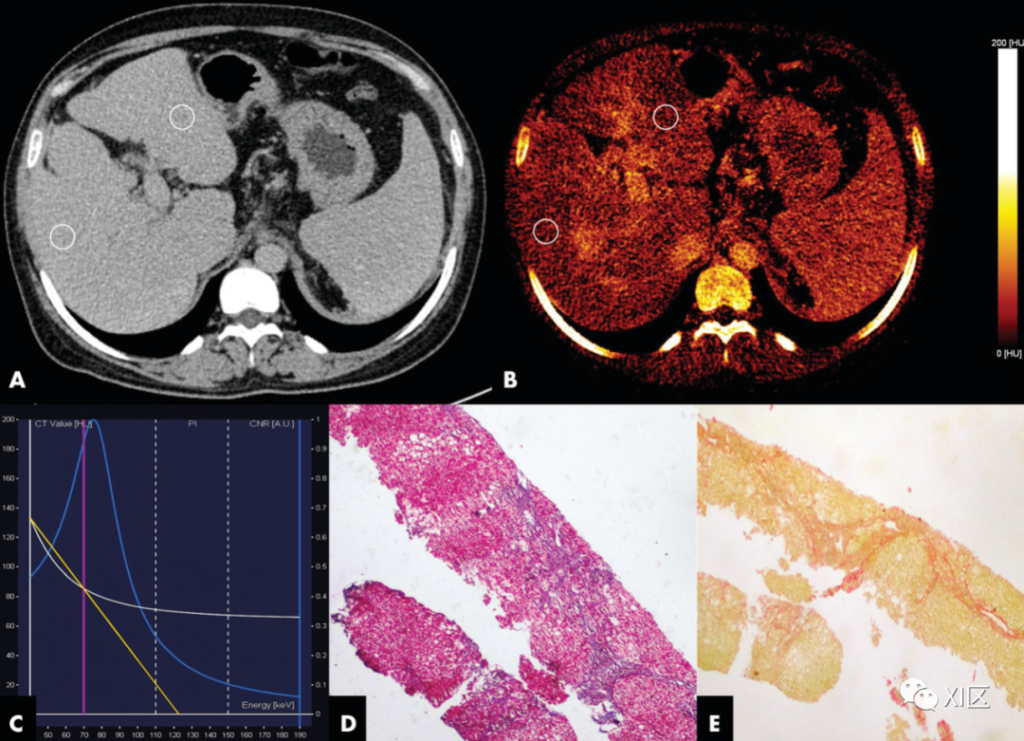
A 26-year-old female with autoimmune hepatitis.
A. Dual-energy CT (DECT) images of the liver in the delayed axial position. The iodine concentration in the right lobe of the liver was 0.9, 0.8, and 0.9 mg/mL, and the iodine concentration in the left lobe of the liver was 0.9, 0.7, and 1 mg/mL, respectively. The iodine concentration in the abdominal aorta was 2.4 mg/mL, and the normalized iodine concentration in the left and right liver lobes were 0.38 and 0.29, respectively.
B. The delayed phase iodine chart shows uneven liver iodine uptake.
C. The figure shows the single energy spectrum curve of DECT. The white line represents the ROI spectrum curve. The blue line is the iodine CNR reference curve. The yellow line is the slope of the single energy spectrum curve measured in the study, which is 1.29HU/keV.
D. The photomicrograph of the biopsy specimen (Masson’s trichrome stain; original magnification, 340) shows METAVIR F3 fibrosis.
E. The photomicrograph (stained with Sirius Red; original magnification, 340) shows that the collagen ratio is 6.7%. The liver stiffness of transient elastography and transverse wave elastography were 13.5kPa and 13.4kPa, respectively.
In the end, a total of 107 subjects (average age 35±12 years; 57 men) and 50 control subjects (average age 47±11 years; 29 women) were evaluated.
RNIC is closely related to METAVIR staging (Spearman r=0.81, P<.001). The AUC of each METAVIR stage RNIC is between 0.86 (95% CI: 0.76, 0.97) and 0.96 (95% CI: 0.92, 0.99).
For F1 fibrosis, the cut-off value of RNIC is 0.24 (sensitivity: 85% [86/101; 95% CI: 77%, 91%]; specificity: 83% [84/101; 95% CI: 42% , 98%]), the critical value of F2 fibrosis is 0.29 (sensitivity: 84% [67/80; 95% CI: 74%, 90%]; specificity: 81% [65/80; 95% CI :63%, 92%]).
RNIC has a good correlation with LS measured by TE and SWE (Spearman r is 0.60 and 0.64, respectively; P<.001).
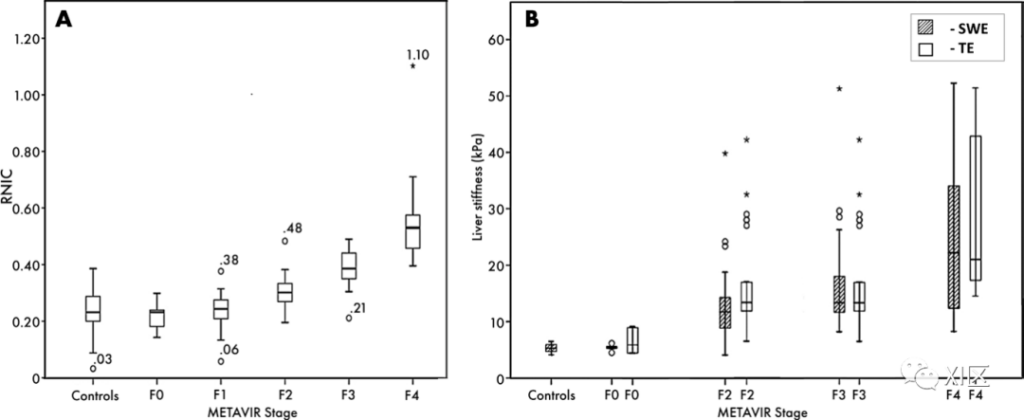
A. The box plot shows the normalized iodine concentration distribution in the right liver lobe (RNIC) of normal subjects and subjects with different METAVIR stages. The numbers are RNIC values for outliers (○) and extreme outliers (*). B. The block diagram shows the distribution and comparison of liver stiffness measured by shear wave elastography (SWE) and transient elastography (TE) in control subjects and subjects with different METAVIR stages. 〇=Outlier, *=Extreme outlier.
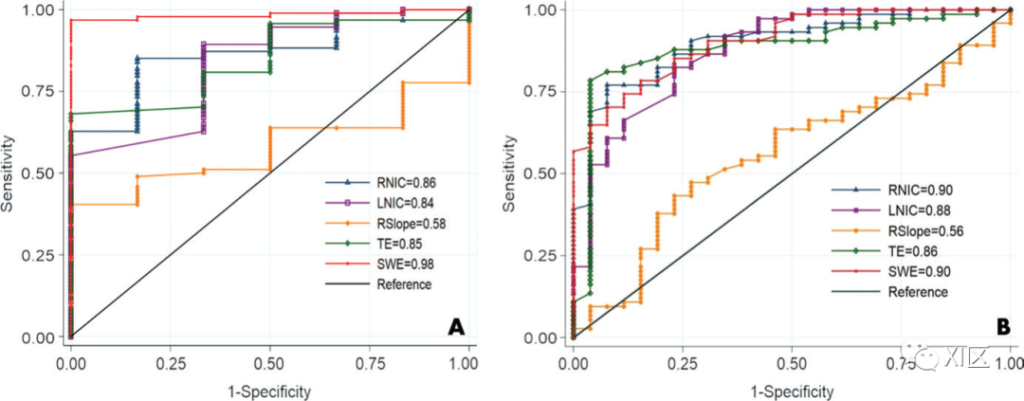
The figure shows the area under the receiver operating characteristic curve (AUC) of the normalized iodine concentration (NIC) of the right liver lobe (RNIC), the normalized iodine concentration (NIC) of the left liver lobe (LNIC), and the slope of the single energy spectrum curve (RSlope) For comparison, transient elastography (TE) and transverse wave elastography (SWE) were used to measure liver stiffness to distinguish different types of fibrosis. A. The figure compares F0 and F1-F4 fibrosis. B. The figure compares F0-F1 stage and F2-F4 stage fibrosis.
In conclusion, in chronic liver disease, dual-energy CT (DECT) with a 5-minute delay shows a strong correlation between the iodine concentration in the liver and the histological stage of liver fibrosis, which has a good diagnostic value in estimating liver fibrosis. Therefore, in the conventional multi-phase CT program for the assessment of chronic liver disease, the implementation of a 5-minute delayed DECT scan instead of the standard 3-minute scan will help non-invasive staging of liver fibrosis.
(source:internet, reference only)
Disclaimer of medicaltrend.org